Scientific Reports 5, 8000 (2015)

Dynamic Phases, Pinning, and Pattern Formation for Driven Dislocation Assemblies

Caizhi Zhou1,2, Charles Reichhardt2, Cynthia J. Olson Reichhardt2,* & Irene J. Beyerlein2

1 Dept. of Materials Science and Engineering, Missouri University of Science and Technology, Rolla, MO 65409, USA
2Theoretical Division, Los Alamos National Laboratory, Los Alamos, New Mexico 87545, USA

Received 1 August 2014
Accepted 9 December 2014
Published 23 January 2015
Correspondence and requests for materials should be addressed to C.J.O.R. (cjrx@lanl.gov)
We examine driven dislocation assemblies and show that they can exhibit a set of dynamical phases remarkably similar to those of driven systems with quenched disorder such as vortices in superconductors, magnetic domain walls, and charge density wave materials. These phases include pinned-jammed, fluctuating, and dynamically ordered states, and each produces distinct dislocation patterns as well as specific features in the noise fluctuations and transport properties. Our work suggests that many of the results established for systems with quenched disorder undergoing plastic depinning transitions can be applied to dislocation systems, providing a new approach for understanding pattern formation and dynamics in these systems.

Simulation
Results and Discussion
References

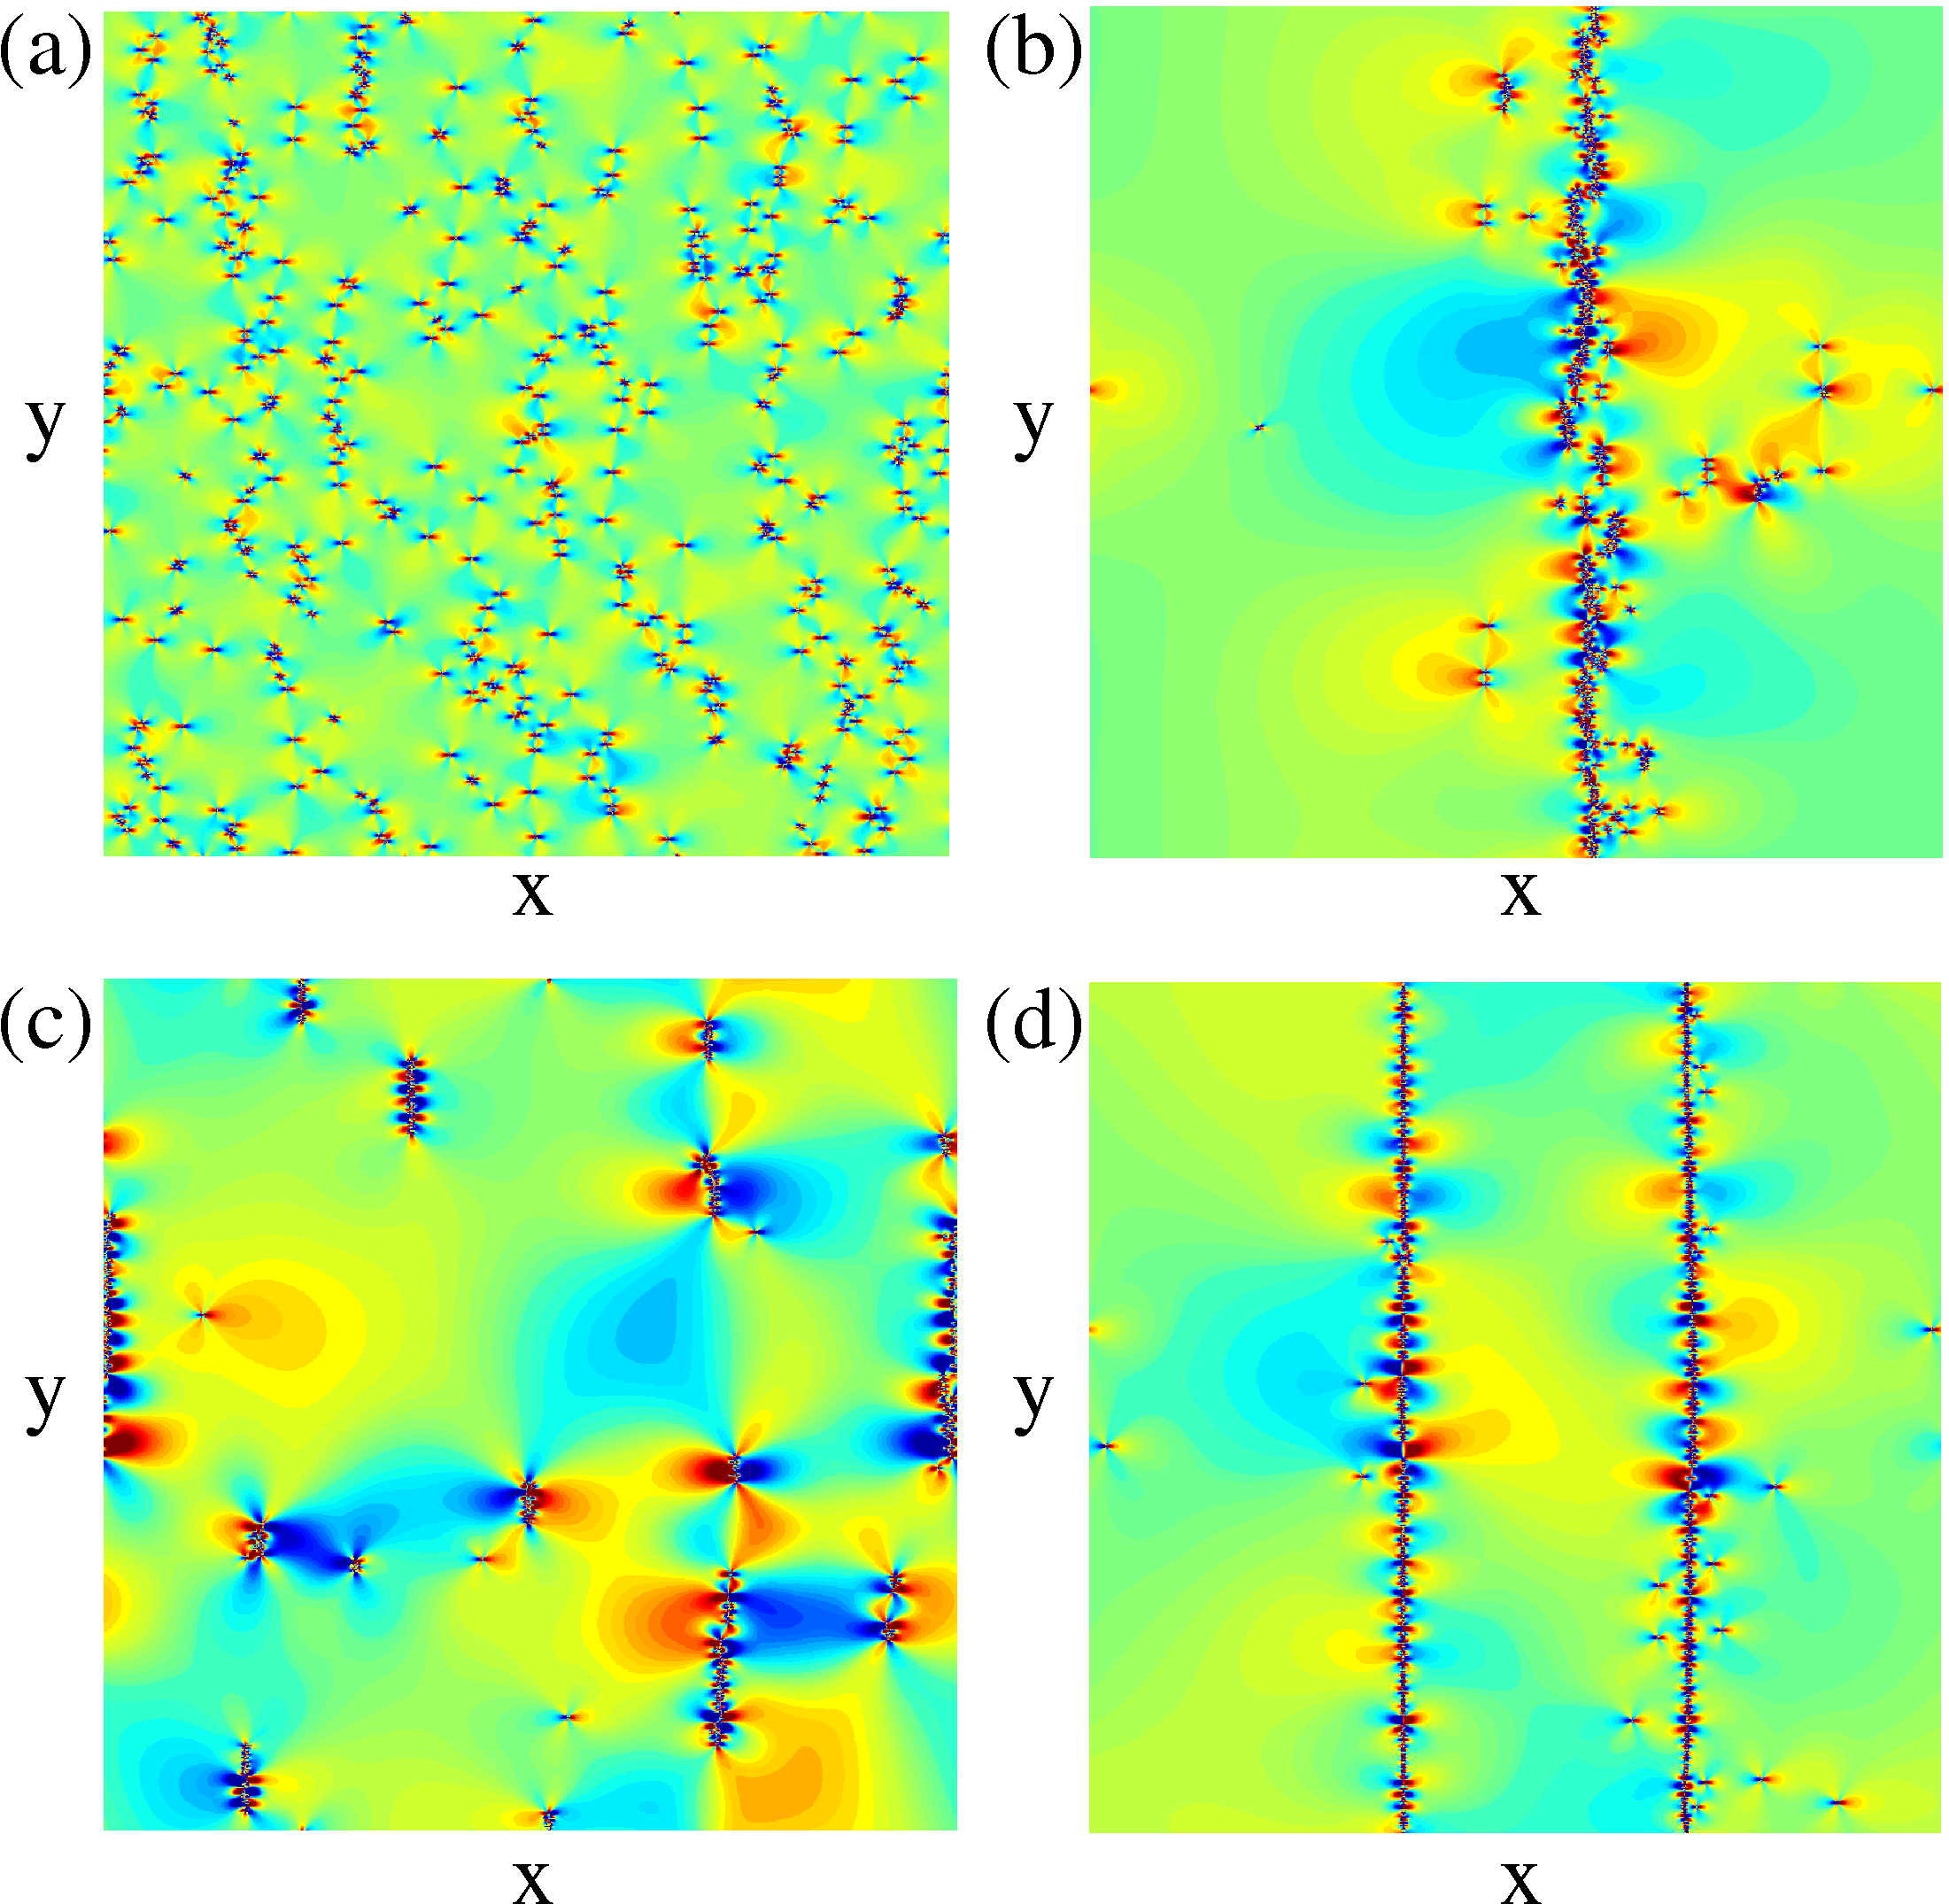
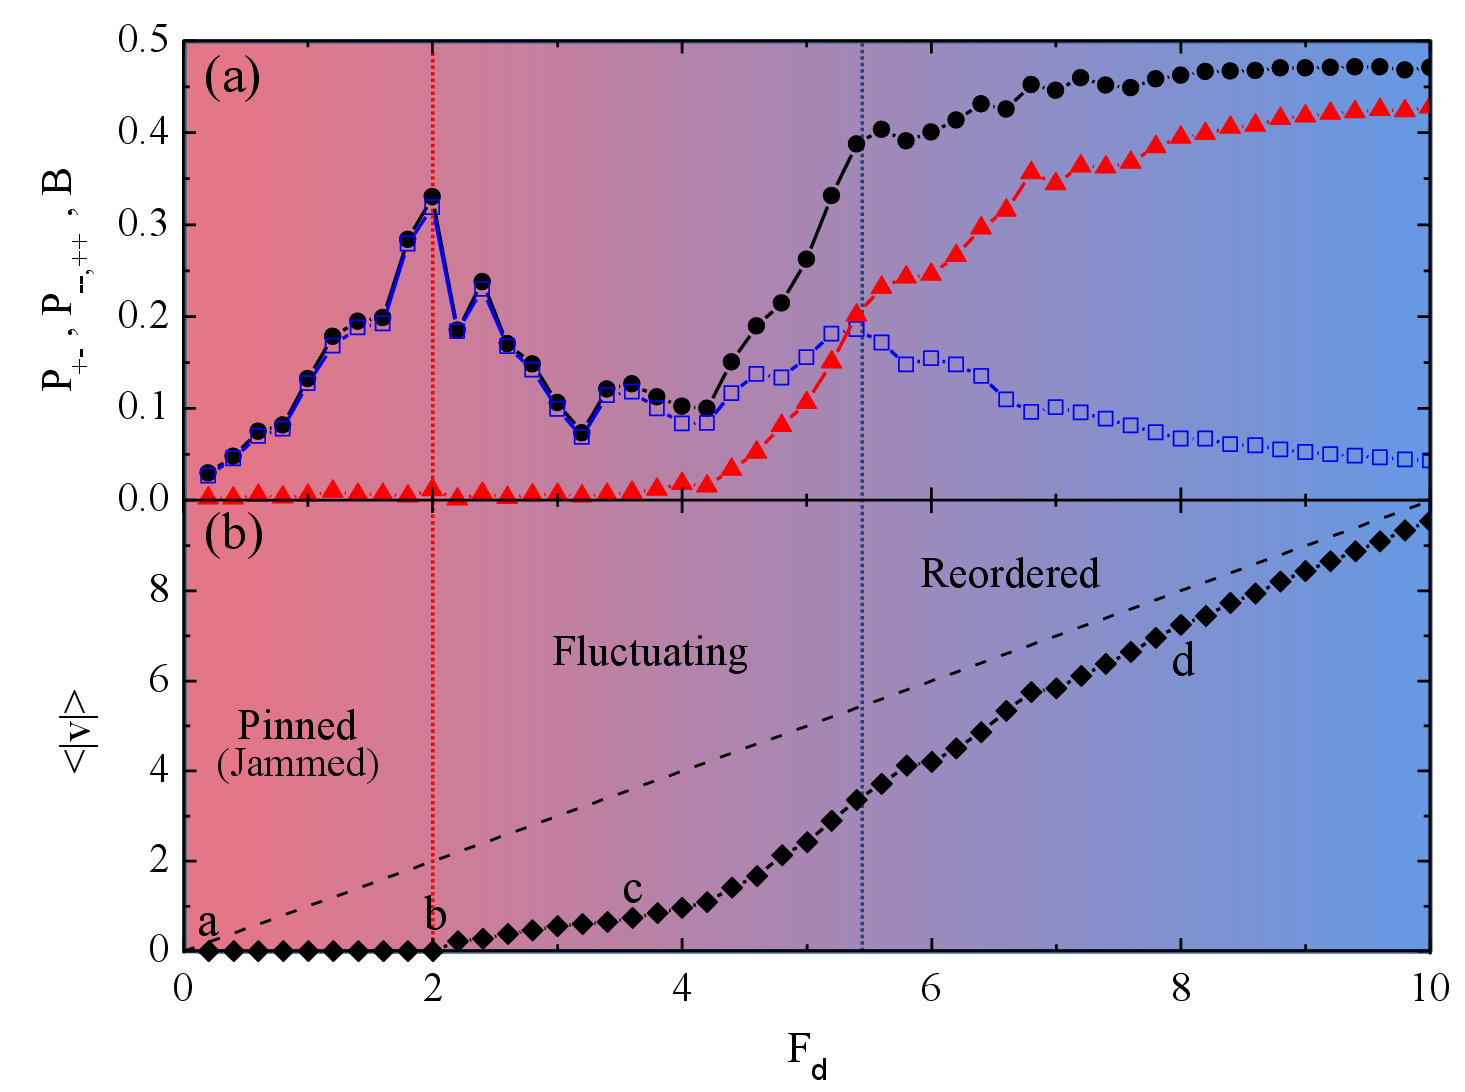
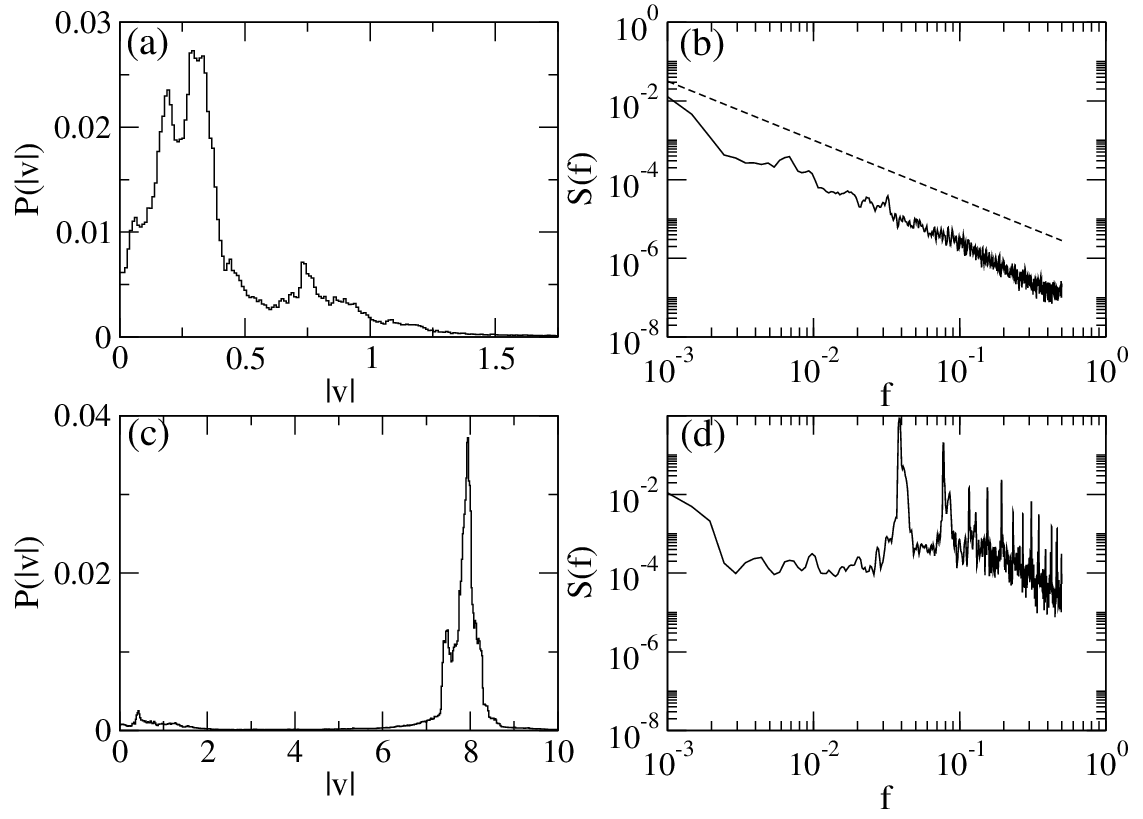
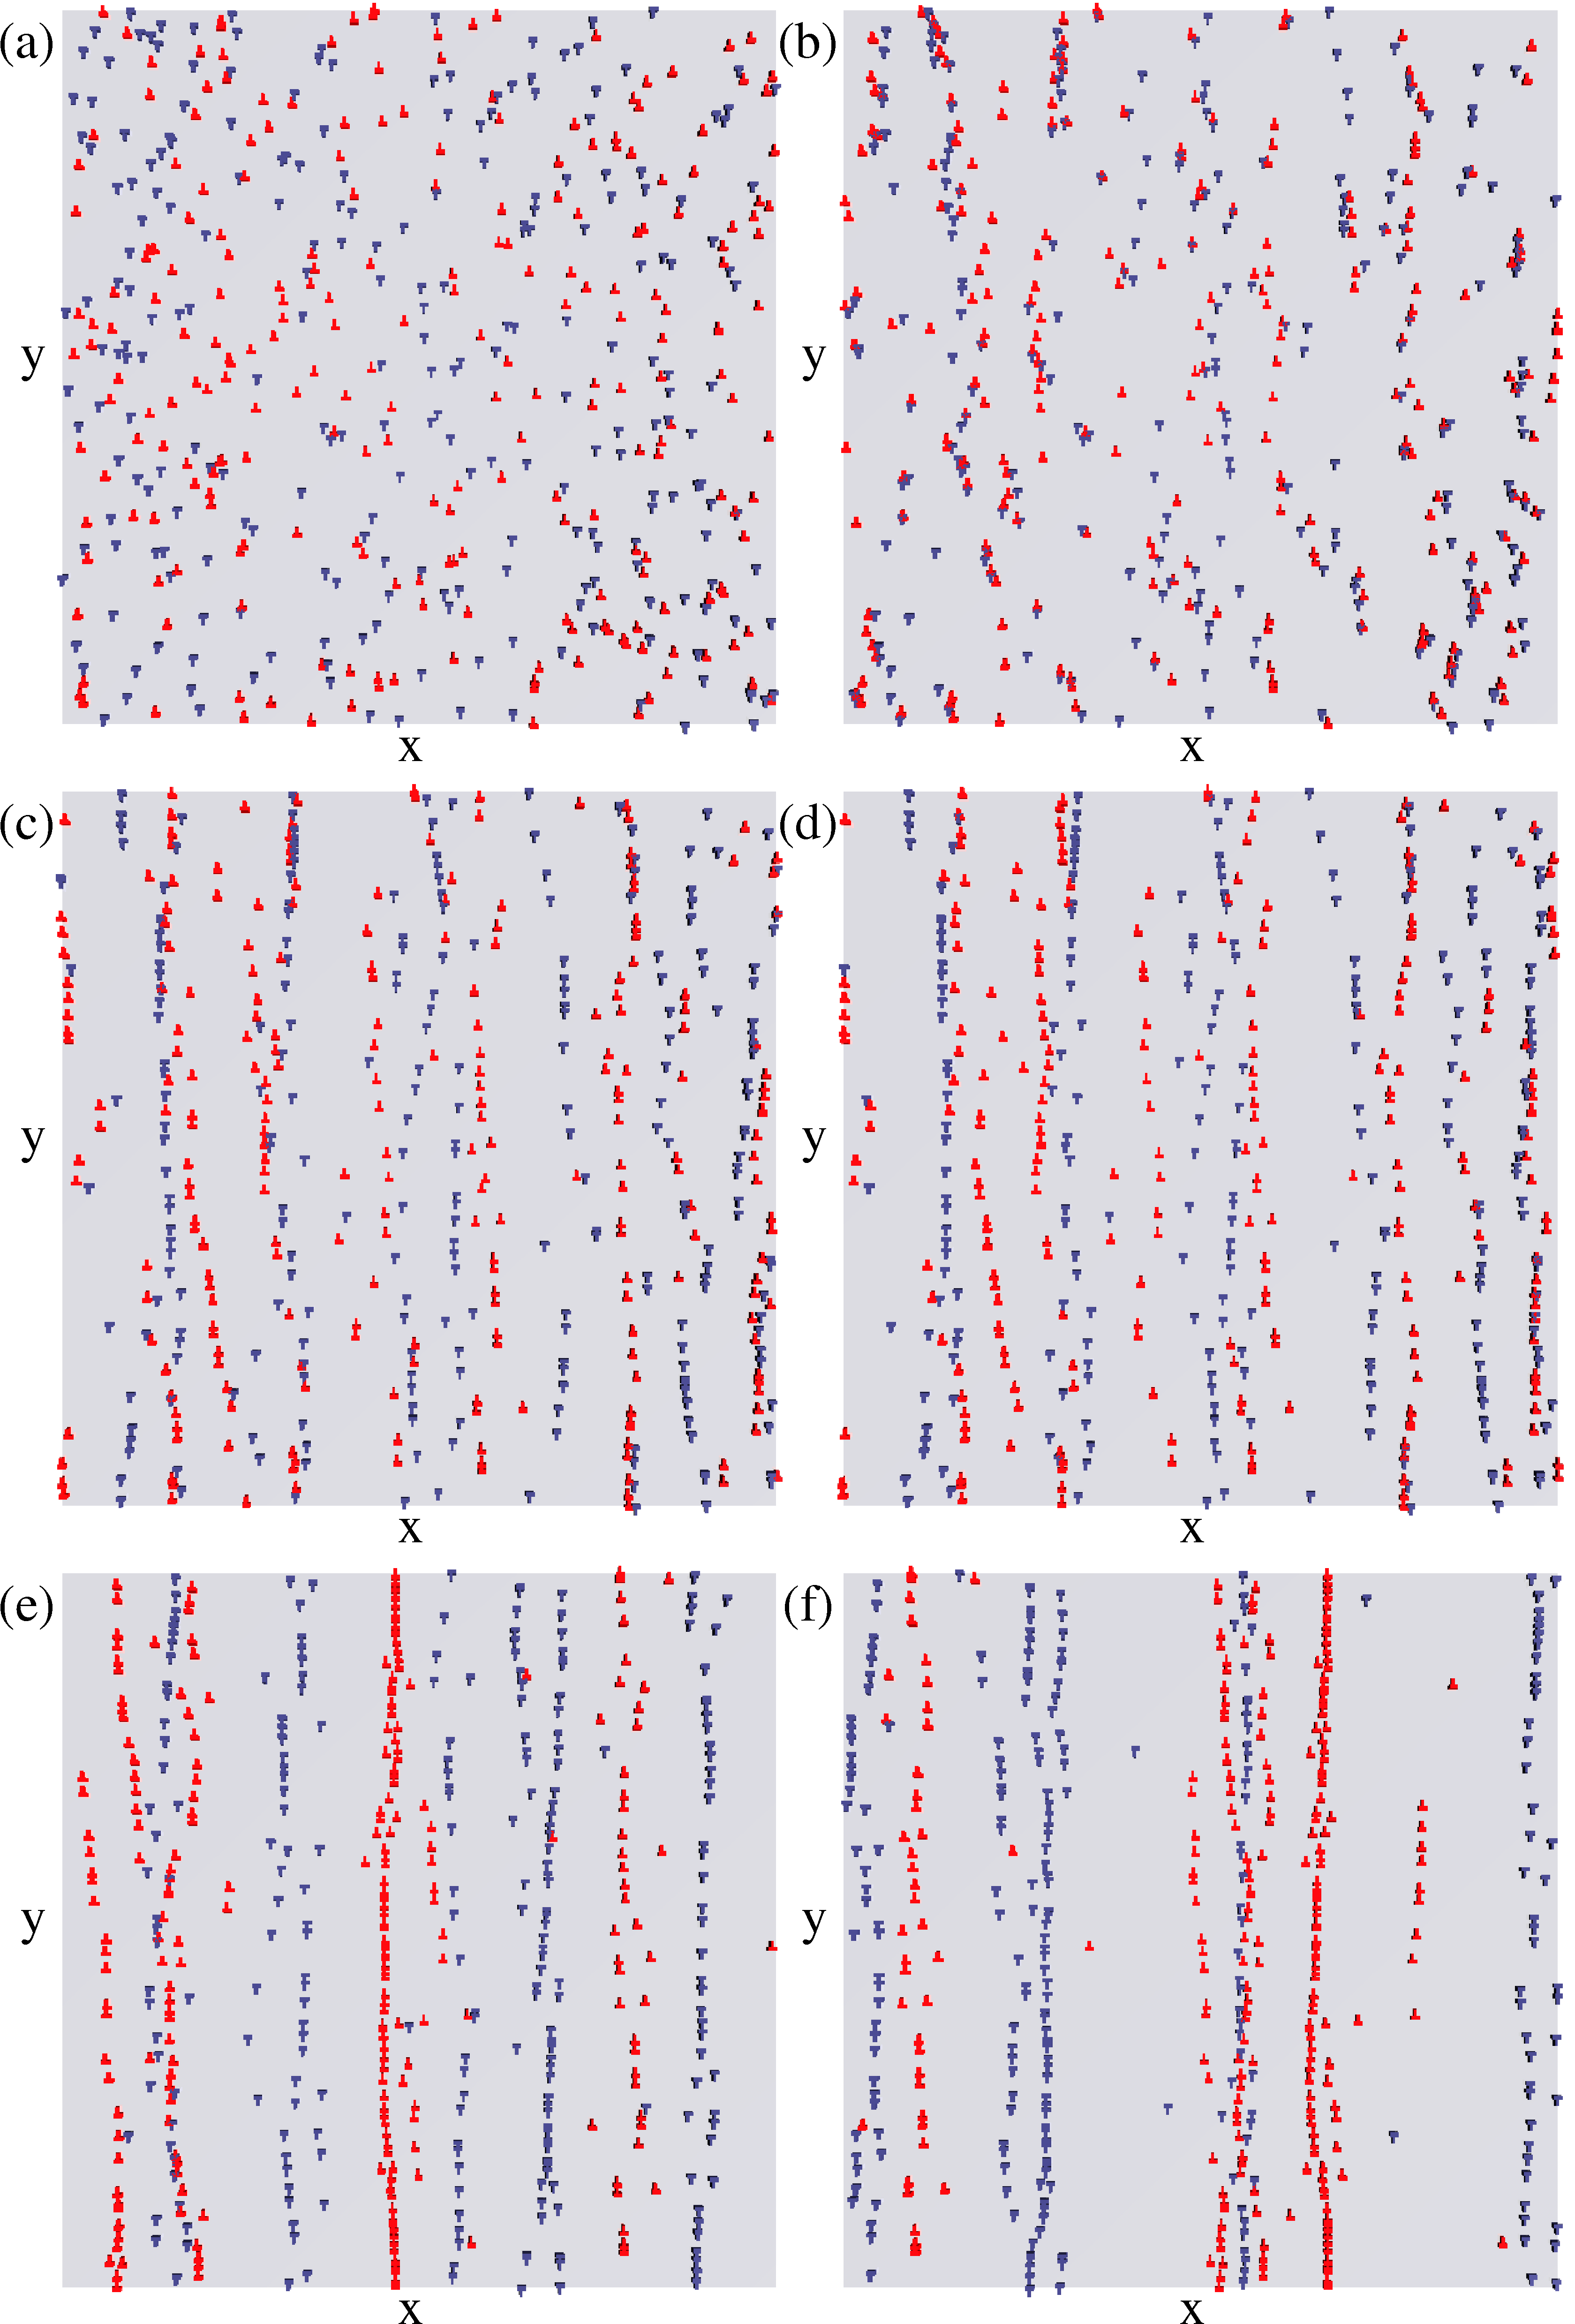
There are numerous examples of systems of collectively interacting particles that, when driven externally, depin and undergo dynamical pattern formation and/or dynamic phase transitions, such as a transition from a fluctuating to a nonfluctuating state. In these systems, which include domain walls, driven vortices in type-II superconductors [1,2,3,4,5,6], sliding charge density waves [7], and driven Wigner crystals [8], fluctuating and intermittent dynamics arise just above a plastic depinning transition when an applied external force is increased from zero. For higher drives the particles dynamically order into patterns such as anisotropic crystals or moving smectic phases with different types of fluctuation statistics [9,10,11,12,13]. Dislocations in materials are known to undergo a transition at the onset of irreversibility or yielding that has similarities to plastic depinning [15,14]; however, it is not known whether driven dislocations exhibit the general features associated with plastic depinning transitions. Establishing such a connection could potentially open a new understanding of driven dislocations. The potential connection between moving dislocations and plastic depinning models has been inspired by recent numerical studies for scaling near the yielding transition which fit to a mean field model for interface type depinning [16].
It is known that organized dislocation structures within individual crystals, such as walls or tangles, can become more refined and better defined as stress or strain increases. Two-dimensional (2D) and three-dimensional (3D) dislocation dynamics simulations based on linear elasticity theory predict self-organization of dislocation assemblies into varying configurations, such as pileups near the yielding or depinning transition [14,15,17], and 2D mobile walls [18,19] or 3D slip bands [20,21] under an external drive. Below a critical stress where dislocations show no net motion, the system is considered jammed or pinned [22,23,24], while intermittent or strongly fluctuating behavior with jerky or avalanche-like motion of the type proposed to be a signature of critical dynamics [18,19,26,27] occurs above the critical stress [18,25]. Here we demonstrate that driven dislocation assemblies exhibit a set of nonequilibrium phases similar to those observed for collectively interacting particle systems undergoing plastic depinning, including pattern organization in the pinned state, a strongly fluctuating intermittent phase with coexisting pinned and moving particles [1,3,10,28,29], and at higher drive, when the substrate effectiveness is reduced, a phase in which the dislocations organize into moving wall structures [2,3,4,6,7,11,12,13]. The onsets of these different dynamical regimes are correlated with pronounced changes in the transport curves [1,5], noise properties [3,30,31], and spatial structures [4,6,9], and can be observed via changes in the dislocation structure, mobility, velocity distribution, and velocity noise. Our work implies that many of the established results obtained for driven vortex and other systems can be used to understand dislocation dynamics.

Simulation

We utilize a discrete dislocation dynamics model for a 2D cross section of a sample with periodic boundary conditions containing N=480 straight edge dislocations that glide along parallel slip planes. We also tested systems with smaller values of N. This model was previously shown to capture the behavior observed in stressed anisotropic materials, such as intermittent flow near the onset of motion [22,23,24,18]. The periodic boundary conditions are of the same type that have been used previously to study intermittent dislocation flow in viscoplastic deformation [18], dislocation jamming and Andrade creep [19], and power-law relaxation of dislocation systems [32] An equal number of positive and negative dislocations are randomly placed in the sample and move in the positive or negative x-direction depending on the sign of their Burgers vector b. Out-of-glide plane motion is forbidden. To prevent in-plane pile-ups, we place at most one dislocation per plane. Rather than imposing an annihilation rule [15,18,19], we enforce that two adjacent glide planes must be separated by at least δy, where δy is on the order of the Burgers vector of the dislocations [22,23,24,32].
The dislocations interact via a long-range anisotropic stress field that is repulsive or attractive depending on their sign and relative angle. We utilize a replicated image model to efficiently simulate a large number of dislocations over long times [33]. Within the simulation volume, all dislocations are subject to the stress fields of all surrounding dislocations regardless of their position. To best make the connection with particle systems, nucleation of dislocations during loading is suppressed. Under an external applied stress τext, dislocation i moves along x in its assigned plane according to an overdamped equation of motion given by η[(dxi)/(dt)]=bi(∑jiN τint(rjri)−τext) where xi is the x coordinate of dislocation i at point ri=(xi,yi) with Burgers vector value bi, η is the effective friction, and τint(rjri) is the long-range shear stress on dislocation i generated by dislocation j. Here our time units are defined such that one simulation time step dt=10−6. The external load on a dislocation is proportional to the stress, Fd = bτext. For r=(x,y)=(xj,yj)−(xi,yi), τint(rjri) is τint(r)=bμ[x(x2y2)]/[2π(1−ν)(x2+y2)2] where μ is the shear modulus and ν is the Poisson's ratio. The length of the square simulation cell L is set to unity and the simulation volume remains fixed throughout loading. In our normalized units, μb/2(1−ν)=1 and η = 1. We initially relax the system without an applied external drive, and then apply the external drive with small enough stress rate and sufficiently long waiting times τwait between increments to avoid transient effects. We measure the average absolute value of the dislocation velocities 〈|v|〉 = ∑i=1N〈|vi|〉, where vi=dxi/dt, as a function of the stress. This is analogous to the voltage versus applied current curve for superconducting vortices, and is the same as the dislocation collective speed defined in Refs. [16,22].
To characterize the dislocation content and charge of the wall structures, we use the pair-correlation distribution dx=|xixj|, the x-axis separation between two dislocations. The fraction of dislocation pairs with dx < w is Pw=ndx < w/ntot, where w is the pre-assigned maximum wall width, ntot is the total number of pairs, and ndx < w is the number of pairs with dx < w. We set w=0.05, although other reasonable values, such as w=0.02, give qualitatively similar results. To distinguish unipolar from dipolar walls, we discriminate between those pairs of like and unlike sign that lie within the critical wall width. We measure B = P++,-P+−, where P++,- (P+−) is the fraction of pairs of like (unlike) sign. B is directly related to the net Burgers vector around one dislocation within the wall width w and P+− indicates the fraction of dipoles in the system. When a dipolar wall forms, B → 0 since P++,-P+−, while when a unipolar wall forms, P+−=0 and B=P++,-.

Results and Discussion

Fig1.png
Figure 1: Stress map snapshots of the sample. The colormap scale is the same in all panels. Red (blue): large negative (positive) stress. (a) The initial dislocation positions at zero load. (b) Just before yielding, a single bipolar wall forms from dislocation pile-ups. (c) Above yielding at Fd=3.6, intermittent structures form. (d) At Fd = 8.0 dynamically ordered polarized walls occur.
As the randomly positioned dislocations relax under zero applied stress, they form a locked configuration determined by the long-range stress fields they collectively produce. The relaxed arrangement shown in Fig. 1(a) is disordered and contains no percolating walls. The internal stresses generated by this spatially random arrangement are high and are distributed uniformly across the volume.
For loads 0 < Fd < 2.0, the dislocation pattern slowly changes after each load increment but 〈|v|〉 goes to zero in the long time limit, indicating that the system is in the jammed phase below the critical yield [22,23,24]. We treat the configuration as stable when 〈|v|〉 < vt, where we take the threshold value vt=0.01, 10 times smaller than the vt used in previous work [22]. Under these low drives, any dislocation motion merely causes the dislocations to lock into another immobilized pattern. Figure 1(b) illustrates a typical locked dislocation configuration for loads just below critical yield (i.e., Fd < Fc), where there is a dipolar wall comprised of a disordered arrangement of positive and negative dislocations that cannot move past one another. This dense bipolar structure effectively screens the dislocation-dislocation interactions. It has a high but localized internal stress field, with large stress concentrations in the vicinity of the wall. Such walls are analogous to the model of a "polarized" wall [34,35], with dislocations of predominantly one sign on one side of the wall and the other sign on the other side. They are thought to be responsible for the observed hysteresis in unloading or the Bauschinger effect in subsequent reverse loadings [36,37]. Observations of polarized walls have also been reported in crystals deformed to large strains [38,39,40].
Just above yielding, the dipolar wall structure breaks down as shown in Fig. 1(c) and the system enters a state characterized by strong fluctuations in the dislocation positions. The dipolar walls repeatedly break up and reform, while the remaining wall fragments become smaller at higher drives and show continual change. The fluctuating state persists up to Fd = 5.0, when a new type of dynamic pattern appears where the dislocations form continuously changing unipolar walls composed of only one type of dislocation, either negative or positive, as shown in Fig. 1(d). These walls can be identified as disordered tilt walls, which are periodic arrays of edge dislocations that accommodate a tilt misorientation between two adjoining crystals. The development of low-misoriented tilt walls is suspected to be a precursor for the eventual formation of subgrains in heavily deformed crystals [41,42]. In our system, when unipolar walls form, the internal stress decreases in intensity. The alternating positive and negative stress pattern that develops along the wall in Fig. 1(d) is consistent with the theoretical prediction for an infinite array of perfectly aligned, like-signed edge dislocations [43] from linear elasticity theory.
Fig2.png
Figure 2: (a) P+− (blue squares), the fraction of dipolar walls, vs Fd has a peak just below yielding. P-,++ (black circles), the fraction of uni-polar walls, passes through a plateau when the polarized wall state forms. B (red triangles) is a measure of the net Burgers vector in the walls. (b) The average absolute value of the dislocation velocity 〈|v|〉 (solid lower curve) vs Fd. The upper dashed curve shows 〈|v|〉 for non-interacting dislocations. Points a, b, c, and d indicate the Fd values illustrated in Fig. 1.
In Fig. 2 we show that the changes in the dislocation structure produce signatures in 〈|v|〉 versus Fd for the system in Fig. 1. The upper curve in Fig. 2(b) shows the simple linear dependence of 〈|v|〉 on Fd expected for a single dislocation. We refer to this dashed line as the Ohmic limit. For the interacting system, 〈|v|〉 is zero below yielding for 0.0 < Fd < 2.0, increases nonlinearly for 2.0 ≤ Fd < 7.5, and then becomes linear again for Fd ≥ 7.5. Near yielding, we find a scaling of the velocity-force curve V ∝ (FdFc)β, where Fc is the yielding point and β = 1. We note that recent simulations of driven dislocations in 2D models have studied the scaling near yield much more exactly and find β = 1.0, consistent with a mean field depinning model [16].
Fig3.png
Figure 3: P+− (blue squares), P-,++ (black circles), and B (red triangles) vs Fd for samples with different numbers of dislocations N= (a) 48, (b) 96, (c) 144, (d) 192, (e) 240, and (f) 360. The same three regimes, pinned, fluctuating, and reordered, occur for all values of N, but shift to different values of Fd as N changes.
Figure 2(a) characterizes the ordering dynamics as a function of Fd. Since the system is initialized in a random state containing no walls, P+− ≈ 0 at Fd=0, but as the load increases, P+ − reaches a maximum just below the yielding point as shown in Fig. 1(b) where a large dipolar wall forms. Above yielding, P+ − decreases in the fluctuating regime when the walls break up, and gradually drops to zero in the high-driving region where the unipolar walls form. To identify the unipolar dislocation walls, we measure P++,-, which rises for Fd > 5.0 in Fig. 2(a). Also shown in Fig. 2(a) is the net Burgers vector of the walls, indicating that for Fd > 5.0 the walls are indeed unipolar and contain either exclusively positive or negative dislocations. At high Fd in the reordered regime, the unipolar wall structures are in motion as indicated by the finite value of 〈|v|〉 in Fig. 2(b). The correlated nature of this motion is indicated by the fact that 〈|v|〉 approaches the dashed Ohmic limit curve more closely as Fd increases. When the dislocation motion is incoherent, as in the fluctuating phase, the deviation between 〈|v|〉 and the Ohmic limit curve is much larger due to the plastic distortions that occur which tear apart the incipient domain walls. Samples with smaller N have the same general features in P+−, P++,-, and B, as shown in Fig. 3. Here, as the density of dislocations increases, the onset of dislocation motion shifts to higher values of Fd due to the more pronounced dislocation-dislocation interactions which enhance the jamming of the dislocations. The features in the curves also become better resolved as N increases.
The dynamics illustrated in Figs. 1 and 2 are remarkably similar to those observed in driven systems with quenched disorder. For example, for vortex matter as a function of external drive, there is a low drive pinned phase, a strongly fluctuating phase with a disordered vortex structure, and a highly driven phase where dynamical pattern formation occurs [2,3,13]. The vortex velocity-force curves also show the same features: the fluctuating phase is correlated with a nonlinear region, while the velocity increases linearly with drive in the dynamically reordered phase [1,3,10,5].
Fig4.png
Figure 4: (a) P(|v|) at Fd = 3.2 in the fluctuating phase. (b) The corresponding S(f) from the time series of the velocity has a 1/f1.5 shape. (c) P(|v|) for Fd = 8.0 in the ordered phase. (d) The corresponding S(f) has a characteristic peak indicating narrow band noise.
The dynamical phases in the vortex system produce changes in the velocity noise fluctuations across different regimes. Just above depinning in the fluctuating regime, there is a strong 1/fα noise signal [1,3] associated with a bimodal velocity distribution from coexisting pinned and moving vortices [3,10,44]. At the onset of dynamical ordering the noise power S0 drops and narrow band noise features appear [3,30]. For the dislocation system, in Fig. 4(a) we plot the instantaneous velocity distribution P(|v|) in the fluctuating phase at Fd = 3.2. Here, a portion of the dislocations are immobilized in pileups while other dislocations have broken out of pileups and are mobile. A similar velocity distribution appears in the fluctuating phase for driven vortices and colloids. The power spectrum S(f) in Fig. 4(b) of the time series of |v| has a 1/f1.5 signal in this regime, in good agreement with driven vortex studies. For Fd = 8.0 in the dynamically ordered phase, we plot P(|v|) in Fig. 4(c), and in Fig. 4(d) we show that S(f) has a narrow band feature with a characteristic frequency generated by the formation of ordered unipolar walls. In Fig. 5(a) the noise power S0 averaged over a fixed low frequency window peaks in the middle of the fluctuating disordered phase and then decreases upon approaching the dynamically ordered phase of unipolar walls. The 1/f1.5 noise signal is obtained from the low frequency range of the spectrum; for higher frequencies, the exponent is closer to 1.75 to 2.0. In recent studies of this same system [16], S(f) above yield in the higher frequency regime had the form 1/f2.
By conducting a series of simulations for varied N and analyzing the ordering dynamics, we construct the dynamic phase diagram shown in Fig. 5(b). The lower curve indicates the yielding transition from the low drive jammed or pinned phase of dipolar walls to the fluctuating disordered phase, as determined by using the dislocation velocity curves. The onset of the fluctuating regime is marked as the point at which the dislocation velocity rises above zero. The onset of the dynamically ordered phase is defined as the force at which the unipolar wall structures start to form, measured as the point at which the fraction of walls reaches 0.4, and is plotted in the upper curve. As N increases, the yielding point rises to higher Fd since the dislocations have a more difficult time breaking through the dipolar walls that form. The increase in yield threshold with increasing N remains robust when we perform simulations with different initial dislocation configurations. Figure 5(b) shows that the onset of the high drive dynamically ordered phase also increases in a similar fashion with increasing N. This phase diagram exhibits the same features observed for vortex systems as a function of pinning strength vs external drive, where both the critical depinning force and the onset of the ordering rise to higher drives with increasing pinning strength [13]. For the dislocation system, increasing N is equivalent to increasing the pinning strength. In our simulation, the pinning strength scales with the total number of dislocations, N, with a power law exponent of 0.7. This value can be linked to the dislocation structures that form. For a random arrangement of dislocations spaced dy apart, the scaling on strength is expected to follow 1/dy1/2, where dy=1/N in our model [45]. In contrast, a 1/dy scaling on strength should arise for systems where the dislocations form well defined walls. Theoretically, the dislocation dipole break stress scales as the vertical distance, dy, between two dipole dislocations [46]. In contrast, in our simulations, the dislocation structure at the onset of yielding develops into a set of wavy dislocation dipole walls, rather than a random arrangement of perfectly aligned dipoles.
Fig5.png
Figure 5: (a) S0 vs Fd averaged over a fixed frequency window centered at f = 10 peaks in the fluctuating phase and drops upon approaching the dynamically ordered phase. (b) A log-log plot of the dynamical phase diagram Fd vs 1/N. Lines indicate a slope of 0.7. Lower curve (red circles): onset of yielding; upper curve (black squares): onset of the dynamically induced ordered phase. The fluctuating phase falls between the two curves.
Fig6.png
Figure 6: The red (blue) crosses are the locations of the dislocations with positive (negative) Burgers vectors in a sample with N=480 that has been instantaneously loaded with Fd=10. The time progression of the formation of multiple unipolar walls is illustrated. (a) Initial dislocation configuration. (b) After 1 time unit. (c) After 3 time units. (d) After 5 time units. (e) After 20 time units. (f) After 149 time units.
It is natural to consider the yielding transition to be some type of depinning transition. There are numerous kinds of depinning, such as the strongly plastic depinning of vortices, colloids, or particles driven over 2D substrates. This type of depinning has been shown to fall into the class of absorbing phase transitions, specifically directed percolation [28,49]. There is also elastic depinning found for elastic lines or interfaces, such as domain walls; this type of depinning would fall into a different universality class of depinning models. The dislocation systems have much longer range interactions than a simple elastic interface; however, recent work on driven dislocation systems [16] has found evidence that the yielding in this class of dislocation systems falls into the class of models of interface depinning. This is consistent with our results in which the dislocations form a wall that can be treated as an interface. In a more disordered dislocation system, the interface would be rougher. The interface picture for the gliding edge dislocations also can be understood by considering that any one dislocation can only move along a 1D line, so it maintains the same neighbors in adjacent planes even if they are not located nearby. In the 2D vortex system there is strong mixing in the directions both transverse and parallel to the drive, and the vortices do not keep their same neighbors over time [28]. It may be possible that in more complex dislocation systems where glide or rotation occurs, the yielding may fall into a different universality class than the mean field interface depinning.
In our simulations we observe dynamical reordering at higher drives when unipolar walls form. In real systems, at large strains the dislocation picture starts to break down, so observing the fully developed unipolar walls may be difficult. It may, however, be possible to observe the initial formation of the unipolar walls along with changes in the noise characteristics. Additionally, in a very clean system with low numbers of dislocations, it may be possible to reach high enough strains that freely flowing dislocations can appear. Free flow of dislocations was recently reported in experimental studies of solid He [50], and there is increasing interest in using solid He as an ideal system for clear studies of very low density dislocation dynamics [51]. Our phase diagram suggests that all three dynamical phases could occur even for low dislocation densities.
The type of ordered state that forms in the strong driving regime varies depending on the manner in which the external load is applied. The ordered polarized walls illustrated in Fig. 1 form under continuous sweeps of the load. If the load is instead instantaneously set to a high value, we observe a transient disordered phase followed by the formation of multiple lower density unipolar walls instead of the two unipolar walls shown in Fig. 1(d). This process is illustrated in Figure 6.
In summary, we have shown that driven dislocation assemblies exhibit the same nonequilibrium phases observed for systems of collectively interacting particles such as vortices in disordered superconductors. These include a jammed phase analogous to a pinned state, a fluctuating or disordered phase, and dynamically ordered or pattern forming states. All of the states are associated with transport signatures such as changes in the transport noise fluctuations as well as features in the dislocation velocity vs applied shear, in analogy with velocity-force curves.

References

[1]
Bhattacharya, S. & Higgins, M.J. Dynamics of a disordered flux line lattice. Phys. Rev. Lett. 70, 2617-2620 (1993).
[2]
Koshelev, A.E. & Vinokur, V.M. Dynamic melting of the vortex lattice. Phys. Rev. Lett. 73, 3580-3583 (1994).
[3]
Olson, C.J., Reichhardt, C. & Nori, F. Nonequilibrium dynamic phase diagram for vortex lattices. Phys. Rev. Lett. 81, 3757-3760 (1998).
[4]
Pardo, F., de la Cruz, F., Gammel, P., Bucher, E. & Bishop, D.J. Observation of smectic and moving-Bragg-glass phase in flowing vortex lattices. Nature (London) 396, 348-350 (1998).
[5]
Hellerqvist, M.C., Ephron, D., White, W.R., Beasley, M.R. & Kapitulnik, A. Vortex dynamics in two-dimensional amorphous Mo77Ge23 films. Phys. Rev. Lett. 76, 4022-4025 (1996).
[6]
Troyanovski, A.M., Aarts, J. & Kes, P.H. Collective and plastic vortex motion in superconductors at high flux densities. Nature (London) 399, 665-668 (1999).
[7]
Danneau, R. et al. Motional ordering of a charge-density wave in the sliding state. Phys. Rev. Lett. 89, 106404 (2002).
[8]
Reichhardt, C., Olson, C.J., Grønbech-Jensen, N. & Nori, F. Moving Wigner glasses and smectics: dynamics of disordered Wigner crystals. Phys. Rev. Lett. 86, 4354 (2001).
[9]
Yaron, U. et al. Structural evidence for a two-step process in the depinning of the superconducting flux-line lattice. Nature (London) 376, 753-755 (1995).
[10]
Faleski, M.C., Marchetti, M.C. & Middleton, A.A. Vortex dynamics and defects in simulated flux flow. Phys. Rev. B 54, 12427-12436 (1996).
[11]
Balents, L., Marchetti, M.C. & Radzihovsky, L. Nonequilibrium steady states of driven periodic media. Phys. Rev. B 57, 7705-7739 (1998).
[12]
Le Doussal, P. & Giamarchi, T. Moving glass theory of driven lattices with disorder. Phys. Rev. B 57, 11356-11403 (1998).
[13]
Moon, K., Scalettar, R.T. & Zimányi, G.T. Dynamical phases of driven vortex systems. Phys. Rev. Lett. 77, 2778-2781 (1996).
[14]
Moretti, P., Miguel, M.-C., Zaiser, M. & Zapperi, S. Depinning transition of dislocation assemblies: Pileups and low-angle grain boundaries. Phys. Rev. B 69, 214103 (2004).
[15]
Laurson, L., Miguel, M.-C. & Alava, M.J. Dynamical correlations near dislocation jamming. Phys. Rev. Lett. 105, 015501 (2010).
[16]
Tsekenis, G., Uhl, J.T., Goldenfeld, N. & Dahmen, K.A. Determination of the universality class of crystal plasticity. EPL 101, 36003 (2013).
[17]
Bakó, B., Weygand, D., Samaras, M., Hoffelner, W. & Zaiser, M. Dislocation depinning transition in a dispersion-strengthened steel. Phys. Rev. B 78, 144104 (2008).
[18]
Miguel, M.-C., Vespignani, A., Zapperi, S., Weiss, J. & Grasso, J.R. Intermittent dislocation flow in viscoplastic deformation. Nature (London) 410, 667-671 (2001).
[19]
Miguel, M.-C., Vespignani, A., Zaiser, M. & Zapperi, S. Dislocation jamming and Andrade creep. Phys. Rev. Lett. 89, 165501 (2002).
[20]
Csikor, F.F., Motz, C., Weygand, D., Zaiser, M. & Zapperi, S. Dislocation avalanches, strain bursts, and the problem of plastic forming at the micrometer scale. Science 318, 251-254 (2007).
[21]
Wang, Z.Q., Beyerlein, I.J. & LeSar, R. Slip band formation and mobile dislocation density generation in high rate deformation of single fcc crystals. Phil. Mag. 88, 1321-1343 (2008).
[22]
Tsekenis, G., Goldenfeld, N. & Dahmen, K.A. Dislocations jam at any density. Phys. Rev. Lett. 106, 105501 (2011).
[23]
Groma, I., Györgyi, G. & Ispanovity, P.D. Comment on "Dislocations jam at any density." Phys. Rev. Lett. 108, 269601 (2012).
[24]
Tsekenis, G., Goldenfeld, N. & Dahmen, K.A. Tsekenis, Goldenfeld, and Dahmen reply. Phys. Rev. Lett. 108, 269602 (2012).
[25]
Zaiser M. Scale invariance in plastic flow of crystalline solids. Adv. Phys. 55, 185 (2006).
[26]
Dimiduk, D.M., Woodward, C., LeSar, R. & Uchic, M.D. Scale-free intermittent flow in crystal plasticity. Science 312, 1188-1190 (2006).
[27]
Laurson, L. & Alava, M.J. 1/f noise and avalanches scaling in plastic deformation. Phys. Rev. E 74, 066106 (2006).
[28]
Reichhardt, C. & Olson Reichhardt, C.J. Random organization and plastic depinning. Phys. Rev. Lett. 103, 168301 (2009).
[29]
Field, S., Witt, J., Nori, F. & Ling, X.S. Superconducting vortex avalanches. Phys. Rev. Lett. 74, 1206-1209 (1995).
[30]
Marley, A.C., Higgins, M.J. &, Bhattacharya, S. Flux flow noise and dynamical transitions in a flux line lattice. Phys. Rev. Lett. 74, 3029-3032 (1995).
[31]
Olson, C.J, Reichhardt, C., & Nori, F. Superconducting vortex avalanches, voltage bursts, and vortex plastic flow: Effect of the microscopic pinning landscape on the macroscopic properties. Phys. Rev. B 56, 6175-6194 (1997).
[32]
Ispánovity, P.D., Groma, I., Györgyi, G., Szabó, P. & Hoffelner, W. Criticality of relaxation in dislocation systems. Phys. Rev. Lett. 107, 085506 (2011).
[33]
Hirth, J.P. & Lothe, J. Theory of Dislocations. (Wiley, New York, 1982).
[34]
Mughrabi, H. A 2-parameter description of heterogeneous dislocation distributions in deformed metal crystals. Mater. Sci. Eng. 85, 15-31 (1987).
[35]
Kuhlman-Wilsdorf, D. Dislocation cells, redundant dislocations and the LEDS hypothesis. Scripta Mater. 34, 641-650 (1996).
[36]
Kocks, U.F., Hasegawa, T. & Scattergood, R.O. On the origin of cell-walls and of lattice misorientations during deformation. Scripta Metal. 14, 449-454 (1980).
[37]
Stout, M.G. & Rollett, A.D. Large-strain Bauschinger effects in FCC metals and alloys. Metal. Trans. A 21, 3201-3213 (1990).
[38]
Xue, Q., Beyerlein, I.J. & Alexander, D.J. Mechanisms for initial grain refinement in OFHC copper during equal channel angular pressing. Acta Mater. 55, 655-668 (2007).
[39]
Huang, X., Borrego, A. & Pantelon, W. Polycrystal deformation and single crystal deformation: dislocation structure and flow stress in copper. Mater. Sci. Eng. A 319-321, 237-241 (2001).
[40]
Hughes, D.A. & Hansen, N. Microstructure and strength of nickel at large strains. Acta Mater. 48, 2985-3004 (2000).
[41]
Dalla Torre, F. et al. Microstructures and properties of copper processed by equal channel angular extrusion for 1-16 passes. Acta Mater. 52, 4819-4832 (2004).
[42]
Dalla Torre, F.H., Pereloma, E.V. & Davies, C.H.J. Strain hardening behavior and deformation kinetics of Cu deformed by equal channel angular extrusion from 1 to 16 passes. Acta Mater. 54, 1135-1146 (2006).
[43]
Li, J.C.M. Electron Microscopy and Strength of Crystals. (Interscience, New York, 1963).
[44]
Pertsinidis, A. & Ling, X.S. Statics and dynamics of 2D colloidal crystals in a random pinning potential. Phys. Rev. Lett. 100, 028303 (2008).
[45]
Taylor, G.I. The mechanism of plastic deformation of crystals. Part I. Theoretical. Proc. Roy. Soc. 145, 362 (1934).
[46]
Li, J.C.M. The interaction of parallel edge dislocations with a simple tilt dislocation wall. Acta Metall. 8, 296 (1960).
[47]
Kocks, U.F. & Mecking, H. Physics and phenomenology of strain hardening: the FCC case. Prog. Mater. Sci. 114, 171-273 (2003).
[48]
Kok, S., Beaudoin, A.J. & Tortorelli, D.A. On the development of stage IV hardening using a model based on the mechanical threshold. Acta Mater. 50, 1653 (2002).
[49]
Okuma, S., Tsugawa, Y., & Motohashi, A. Transitions from reversible to irreversible flow: Absorbing and depinning transitions in a sheared-vortex system. Phys. Rev. B 83, 024507 (2011).
[50]
Haziot, A., Rojas, X., Fefferman, A.D., Beamish, J.R. & Balibar, S. Giant plasticity of a quantum crystal. Phys. Rev. Lett. 110, 035301 (2013).
[51]
Haziot, A., Fefferman, A.D., Beamish, J.R. & Balibar, S. Dislocation densities and lengths in solid He-4 from elasticity measurements. Phys. Rev. B 87, 060509 (2013).
Acknowledgments
We acknowledge helpful discussions with Karen Dahmen. This work was carried out under the auspices of the NNSA of the US DoE at LANL under Contract No. DE-AC52-06NA25396. C.Z. also received partial support from UMRB funding.
Author Contributions
C.R., C.J.O.R., and I.J.B. designed the study. C.Z. carried out the simulations. C.Z. and C.J.O.R. performed the analysis. All authors discussed the results and wrote the manuscript.
Competing Financial Interests
The authors declare no competing financial interests.


File translated from TEX by TTHgold, version 4.00.
Back to Home