Journal of Physics: Condensed Matter 16, 7909 (2004)

Re-entrant disordering of colloidal molecular crystals on two-dimensional periodic substrates

M Mikulisf,f , C J Olson Reichhardtf, C Reichhardtf , R T Scalettarf and G T Zimányif

f Center for Nonlinear Studies and Theoretical Division, Los Alamos National Laboratory, Los Alamos, New Mexico 87545.
f Department of Physics, University of California, Davis, California 95616.

Received 23 April 2004, in final form 2 September 2004
Published 29 October 2004
Online at stacks.iop.org/JPhysCM/16/7909
doi:10.1088/0953-8984/16/45/013

Abstract
Using numerical simulations, we study colloidal ordering and disordering on two-dimensional periodic substrates where the number of colloids per substrate minima is two or three. The colloids form dimer or trimer states with orientational ordering, referred to as colloidal molecular crystals. At a fixed temperature such that, in the absence of a substrate, the colloids are in a triangular floating solid state, upon increasing the substrate strength we find a transition to an ordered colloidal molecular crystal state, followed by a transition to a disordered state where the colloids still form dimers or trimers but the orientational order is lost. These results are in agreement with recent experiments.


Colloidal particle assemblies in two dimensions (2D) are an ideal system to study ordering and melting, since quantities such as diffusion, dislocation dynamics, and local ordering can be directly observed, which is typically not the case for atomic and molecular systems [1]. Repulsively interacting colloids on a smooth substrate in 2D form triangular arrangements at high density or low temperatures, with hexatic or liquid states at lower densities [1], and have been used to explore two-dimensional melting [2,3,4,5] and structural transitions [6], both experimentally [7] and in simulations [8]. Optical techniques such as interfering laser arrays have created one-dimensional (1D) line-like potentials which attract the colloids. Experimental studies of periodic 1D potentials find a remarkable laser-induced freezing transition, where for zero substrate strength the colloids form a disordered liquid, but with increasing substrate or laser strength there is a transition to a frozen ordered state [9]. This laser-induced freezing was studied with density-functional theory [10] and simulations [11]. These theoretical works also found that for increased substrate strength, the frozen state can show a reentrant disordering transition to a 1D modulated liquid. This reentrance was similar to that subsequently observed in experiments [12,13]. Further theoretical studies have mapped additional properties of this system [14], including the presence of locked floating solids and smectic phases as well as the orientational dependence of the melting temperature, and some of these predictions, including the laser-induced melting transition into the reentrant phase, have also been confirmed in experiment [15]. The reentrant disordering occurs because, as the substrate strength is gradually increased, the system becomes effectively 1D. The fluctuations are enhanced for lower dimensionality and can lead to the formation of a 1D liquid.
More recently, colloidal assemblies interacting with 2D periodic substrates have been investigated [16,17,18,19]. Simulations of colloids on 2D periodic substrates have considered the case where the number of colloids is an integer multiple of the number of potential minima [16]. In this case, multiple colloids sit in each potential minimum and form dimer, trimer, or higher states depending on the filling. These colloidal states can have an additional orientational ordering and have been termed colloidal molecular crystals (CMCs) in analogy with molecules forming crystalline states with orientational ordering of the molecules. Three phases appear in the simulations: a high temperature liquid regime, a low temperature orientationally ordered CMC, and an intermediate disordered CMC phase where the orientational order is lost but the colloids remain trapped in each minimum, rotating freely but not diffusing. Experiments on 2D periodic optical traps with three colloids per potential minimum confirmed the existence of the three phases [17]. In these experiments, the temperature and density of the system were fixed and the intensity of the traps was increased by tuning the laser power. Here, as a function of increasing substrate strength, the initial state was a liquid, followed by a transition to an orientationally ordered CMC and, at higher strengths, a transition to a disordered CMC. This reentrant disordering is similar to that found for 1D periodic modulated substrates. While some previous simulations [16] indicate reentrance, it was not carefully explored.
In this work we measure the diffusion of colloids from their traps and also the degree of rotational order between molecules in adjacent wells. We then numerically map the phase diagram as a function of substrate strength. We observe four phases, floating (triangular) solid, rotationally ordered and disordered colloidal molecular crystal, and liquid. The transition to the liquid state rises monotonically in temperature with the substrate potential strength, but the transition from the ordered to the disordered CMC phase first increases and then decreases in temperature with increasing substrate strength. This leads to a striking feature of the phase diagram: clear evidence for a reentrant disordered CMC as a function of substrate strength.
As we shall describe, the phase diagram presented in this work, in addition to having higher resolution than in previous studies, also extends previous work by clearly indicating the region of phase space in which a floating solid occurs. That is, we identify the regime at weak and zero substrate potential where the colloids order into a triangular lattice. We also present a phase diagram for the case when the colloid number is three times the number of substrate minima, thereby quantifying the behavior of the system at this filling.
We perform a Langevin simulation of a 2D system with periodic boundary conditions in the x and y directions, as in previous work [16]. There are N colloids interacting with a 2D periodic substrate which has M minima. We focus on the two cases N/M = 2 and 3. The overdamped equation of motion for a single colloid i is
d ri

dt
= fi + fs + fT  ,
(1)
where fi = ∑jiN−∇i V(rij) is the interaction force from the other colloids, which we take to be a Yukawa or screened Coulomb form, V(rij) = (Q2/|rirj|)exp(−κ|rirj|). Here Q is the charge of the particles, which we set to 1.0, 1/κ is the screening length, and ri is the position of particle i. We consider a square substrate with lattice constant a and force fs = Asin(2πx/a)x + Asin(2πy/a)y. The screening length 1/κ is set to 1.5a; a larger screening length (such as that used in [16]) would shift the phase boundaries to higher substrate strengths. In this work we keep a fixed and vary A. The thermal force fT comes from Langevin kicks with the properties < fT > =0 and < fTi(t)fTj(t) > =2kBTδijδ(tt′). The dimensionless temperature can be expressed in units of Q2/a kB. The initial colloidal positions are obtained by annealing from a high temperature T=0.5 where the colloids are diffusing freely, and gradually cooling to zero in increments of T=1.25 ×10⁻⁵. We equilibrated the sample for 20000 molecular dynamics steps at each increment. We checked our results by both decreasing the temperature increment and increasing the number of time steps spent at each increment, and found that our results are robust.
We first concentrate on the case N/M = 2. As a function of T and A, we find the four phases illustrated in figure 1. For very low A and T, we find a floating triangular lattice as shown in figure 1(a), where the substrate is weak enough that the elastic interaction of the colloids dominates and they form a triangular lattice. At high enough T, for all A we find a modulated liquid where the colloids are disordered and have a large diffusion constant, as shown in figure 1(b). For low T and large enough A, the orientationally ordered CMC of figure 1(c) forms. Each potential minima captures two colloids and the colloid dimer orientation alternates from vertical to horizontal. For larger A and T, a disordered CMC phase occurs in which the colloids are still fixed to the potential minima but long range orientational ordering is lost, as seen in figure 1(d).
Fig1.png
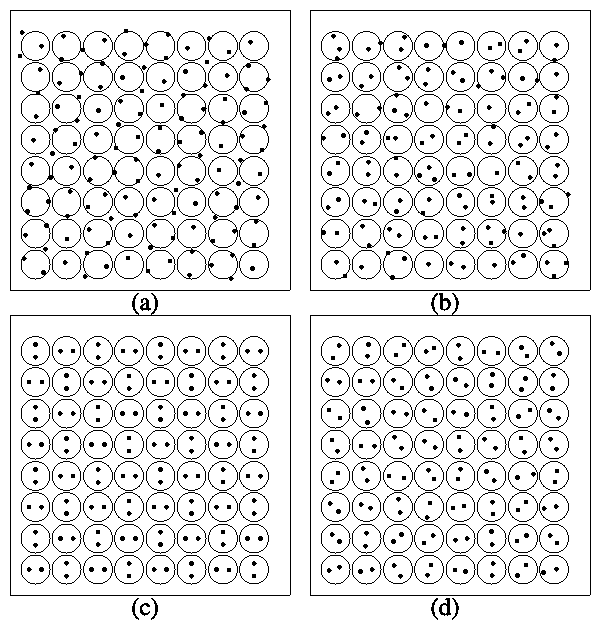
Figure 1: The colloidal configurations for a square periodic substrate in 2D. The circles indicate the location of the potential wells. (a) For a sufficiently weak substrate potential, at low temperatures, (here A=0.0, T=0.0) the colloids form a floating triangular lattice, which has some mild distortion (see text). (b) At high enough temperature, for any substrate potential, (here A=1.0, T=0.125) the colloids form a liquid. (c) For all but the smallest potentials, at low temperatures, (here A=1.0, T=0.0) the colloids form a rotationally ordered solid. (d) For large enough substrate potentials, (here A=1.0, T=0.026) an intermediate disordered CMC phase exists between the rotationally ordered solid phase and the liquid phase.
We use various measures to identify the different phases in the T vs A phase diagram. In order to locate the ordered to disordered CMC transition, we measure the rotational disorder fraction F of the particles. To determine F, we define each dimer to be horizontally or vertically oriented depending on whether the x or y component of the vector joining the two colloids is larger. F is then defined as the fraction of the dimers which differ from the ordered CMC configuration of alternating vertical and horizontal orientations. This quantity is zero in the ordered solid phase and saturates to a higher value when the orientational ordering is lost. In figure 2 we plot F vs T for different values of A. The transition temperature first increases from A = 0.25 to A = 0.50, but then decreases for larger values of A.
To distinguish between the CMC phases and the liquid phase, we measure the diffusion D of the particles by calculating the average of the square of the distance traveled by the particles from their initial positions after a large, fixed number of time steps. In figure 3, we plot D as a function of temperature T for different potential depths A. The first low-temperature step-like increase in D corresponds to the ordered/disordered CMC phase transition (since the particles are now rotating freely) and the second much larger increase indicates the transition into a liquid state. The melting temperature is defined as the point at which D first increases sharply, when the particles are no longer bound in the potential wells. This temperature rises monotonically with A. For high values of A, the colloid dimers are no longer in a rotationally ordered configuration before they leave the wells, showing the existence of the disordered CMC. We measured the transitions for several different initial starting configurations of the colloids and found that the results were unchanged.
Fig2.png
Figure 2: Rotational disorder fraction vs temperature, for (from left to right) A=3.0, 2.0, 1.50, 0.25, and 0.50. The phase transition from the ordered CMC to the disordered CMC state is defined as the temperature at which F=0.4. The transition temperature first increases from A=0.25 to A=0.50, but then decreases for larger A.
Fig3.png
Figure 3: Diffusion vs temperature for (from left to right) A=0.25, 0.5, 1.0, 1.5, 2.0, 2.5, and 3.0. The melting temperature is defined as the point at which D first increases sharply, when the particles are no longer bound in the potential wells.
In figure 4 we plot the transition lines from the ordered CMC to the liquid, floating solid, and disordered CMC states, obtained using the measures illustrated in figure 2 and figure 3. Here, the range of temperature over which the ordered CMC phase exists increases in extent as A increases from the CMC onset at A=0.06, reaching a maximum width at A=0.75. As A is further increased above A=0.75, the width in T of the ordered CMC phase decreases, showing a slight nonlinearity. The transition line between the disordered CMC and the liquid moves to higher temperatures roughly linearly as A increases, as expected, since it represents a first-order phase transition. For values of A < 0.5, the two transition lines converge, indicating that the ordered solid melts directly into the liquid phase without passing through a disordered solid phase. Figure 4 shows a clear disordering reentrance. For a fixed T = 0.016, the colloids are in a liquid state at A = 0. A transition to the ordered CMC state occurs at A ≈ 0.19, while a transition to the disordered CMC state occurs at A ≈ 1.07. This sequence of transitions for increasing substrate strength is exactly what is seen in experiment [17].
Fig4.png
Figure 4: Phase diagram of temperature vs potential strength A. In region I the colloids form a floating solid triangular lattice. In region II the colloids are in a liquid state. Region III contains a rotationally ordered solid. Finally, in region IV the colloids are in a solid state which has no rotational ordering. Circles indicate the transition to the ordered CMC as determined by the rotational disorder fraction F. Squares indicate the melting transition measured from the diffusion D.
The initial increase in the disordering temperature with substrate strength occurs due to the fact that some finite substrate strength is required to confine the colloids, which are either in a floating solid or liquid state for a very weak substrate. When the potential is just strong enough to trap the colloids, the size of each dimer (the distance between the two colloids composing the dimer) is at its maximum, and the colloids are close to jumping out of the confining well. At a somewhat higher temperature, the colloids begin to diffuse; thus, as the potential strength increases, the temperature at which diffusion begins also increases. We note that the cause of the orientational ordering of the dimers is their effective quadrupole moment. The energy of interaction between these moments is minimized when the dimers are oriented as in figure 1(c). The strength of the quadrupole moment is proportional to the square of the distance between the two colloids in a single potential minimum. As A is increased, this distance decreases. If we approximate the well confining the colloids as a parabola, then the distance between the colloids in the dimer decreases by δrA. As the strength of the quadrupole moment drops, thermal effects dominate the orientational ordering and the colloidal dimer begins to rotate, destroying the orientational ordering.
In figure 5 we show a blowup of the phase diagram from figure 4 for the region with small A. Here, we find that at low temperatures the elastic interactions between the colloids dominate over the substrate, and an almost triangular lattice forms. We call this a floating solid since the system is effectively frozen with no diffusion. In figure 6 we show the rotational disorder fraction plot for small values for A, which was used to identify the floating solid phase.
Fig5.png
Figure 5: Phase diagram of temperature vs A at small A, highlighting the floating solid region.
Fig6.png
Figure 6: Rotational disorder fraction F vs temperature for (from left to right) A=0, 0.05, 0.06, 0.07, 0.10, 0.20, 0.30, and 0.50. For A ≤ 0.07, the colloids are initially (T=0) in a floating solid state. The rotational disorder fraction exceeds 0.4 for these values of A at all temperatures.
In order to show that the reentrant disordering is a general feature for CMC states we have considered other integer fillings as well. In figure 7 we plot the phase diagram using the same measures as in figure 4 for the case of N/M = 3 on a square substrate. This is the filling fraction used in recent experiments [17]. Here the ordered CMC is the same as found in earlier simulations [16]. The phase diagram has the same basic features as in figure 4, where M/N=2 and dimers form in the wells. However, the critical temperatures are a bit lower, as is reasonable, and while the non-monotonic (re-entrant) behavior of the rotational melting line is still clearly evident, the liquid at small A does not extend as deeply below the peak in the rotationally ordered phase.
Fig7.png
Figure 7: Phase diagram of temperature vs A for trimer states. The same four phases occur as in the dimer states, namely: I - floating solid, II - liquid, III - ordered CMC (colloid molecular crystal), and IV - disordered CMC.
In conclusion, we have shown clear numerical evidence for reentrant disordering of colloidal molecular crystals on 2D periodic substrates for increasing substrate strength and fixed temperature, in agreement with recent experiments. We map out the temperature vs substrate phase diagram and show that four phases can occur: a high temperature liquid, a triangular floating solid, an orientationally ordered colloidal molecular crystal state, and a disordered colloidal molecular crystal state.
Acknowledgements
We thank C. Bechinger for useful discussions. This work was supported by the US DoE under Contract No. W-7405-ENG-36, by the LANL/UC CARE and CLE programs, and by NSF-DMR-0312261.

References

[1]
Murray C A and Winkle D H V 1987 Phys. Rev. Lett. 58 1200 Zahn K, Lenke R and Maret G 1999 Phys. Rev. Lett. 82 2721 Pertsinidis A and Ling X S 2001 Nature (London) 413 147
[2]
Kosterlitz J M and Thouless D J 1973 J. Phys. C: Solid State Phys. 6 1181
[3]
Halperin B I and Nelson D R 1978 Phys. Rev. Lett. 41 121 Nelson D R and Halperin B I 1979 Phys. Rev. B 19 2457
[4]
Young A P 1979 Phys. Rev. B 19 1855
[5]
For a review, see Strandburg K J 1988 Rev. Mod. Phys. 60 161
[6]
Sun J and Stirner T 2003 Phys. Rev. E 67 051107
[7]
Pieranski P 1980 Phys. Rev. Lett. 45 569 Murray C A and Van Winkle D H 1987 Phys. Rev. Lett. 58 1200 Murray C A and Wenk R A 1989 Phys. Rev. Lett. 62 1643 Tang Y, Armstrong A J, Mockler R C and O'Sullivan W J 1989 Phys. Rev. Lett. 62 2401 Armstrong A J, Mockler R C and O'Sullivan W J 1989 J. Phys: Condens. Matter 1 1707 Kusner R E, Mann J A, Kerins J and Dahm A J 1994 Phys. Rev. Lett. 73 3113 Kusner R E, Mann J A and Dahm A J 1995 Phys. Rev. B 51 5746 Marcus A H and Rice S A 1996 Phys. Rev. Lett. 77 2577 Marcus A H and Rice S A 1997 Phys. Rev. E 55 637 Zahn K, Lenke R and Maret G 1999 Phys. Rev. Lett. 82 2721
[8]
Frenkel D and McTague J P 1979 Phys. Rev. Lett. 42 1632 Toxvaerd S 1980 Phys. Rev. Lett. 44 1002 Kalia R K and Vashishta P 1981 J. Phys. C: Solid State Phys. 14 L643 Naidoo K J and Schnitker J 1994 J. Chem. Phys. 100 3114 Bagchi K, Anderson H C and Swope W 1996 Phys. Rev. Lett. 76 255 Zangi R and Rice S A 1998 Phys. Rev. E 58 7529 Terao T and Nakayama T 1999 Phys. Rev. E 60 7157
[9]
Chowdhury A, Ackerson B J and Clark N A 1985 Phys. Rev. Lett. 55 833
[10]
Chakrabarti J, Krishnamurthy H R and Sood A K 1994 Phys. Rev. Lett. 73 2923
[11]
Chakrabarti J, Krishnamurthy H R, Sood A K and Sengupta S 1995 Phys. Rev. Lett. 75 2232
[12]
Wei Q-H, Bechinger C, Rudhardt D and Leiderer P 1998 Phys. Rev. Lett. 81 2606
[13]
Bechinger C, Brunner M and Leiderer P 2001 Phys. Rev. Lett. 86 930
[14]
Frey E, Nelson D R and Radzihovsky L 1998 Phys. Rev. Lett. 83 2977 Radzihovsky L, Frey E and Nelson D R 2001 Phys. Rev. E 63 031503
[15]
Bechinger C and Frey E 2001 J. Phys: Condens. Matter 13 R321
[16]
Reichhardt C and Olson C J 2002 Phys. Rev. Lett. 88 248301
[17]
Brunner M and Bechinger C 2002 Phys. Rev. Lett. 88 248302
[18]
Mangold K, Leiderer P and Bechinger C 2003 Phys. Rev. Lett.  90 158302
[19]
Korda P T, Spalding G C and Grier D G 2002 Phys. Rev. B 66 024504 Korda P T, Taylor M B and Grier D G 2002 Phys. Rev. Lett. 89 128301


File translated from TEX by TTHgold, version 4.00.

Back to Home