Physical Review E 78, 031401 (2008)

Enhancing Mixing and Diffusion with Plastic Flow

A. Libál1,2, C. Reichhardt3 and C.J. Olson Reichhardt3

1Center for Nonlinear Studies, Los Alamos National Laboratory, Los Alamos, New Mexico 87545, USA
2Department of Physics, University of Notre Dame, Notre Dame, Indiana 46556, USA
3Theoretical Division, Los Alamos National Laboratory, Los Alamos, New Mexico 87545, USA

(Received 2 July 2008; published 2 September 2008)

We use numerical simulations to examine two-dimensional particle mixtures that strongly phase separate in equilibrium. When the system is externally driven in the presence of quenched disorder, plastic flow occurs in the form of meandering and strongly mixing channels. In some cases this can produce a fast and complete mixing of previously segregated particle species, as well as an enhancement of transverse diffusion even in the absence of thermal fluctuations. We map the mixing phase diagram as a function of external driving and quenched disorder parameters.


There have been a growing number of experiments on collections of small particles such as colloids moving over periodic or complex energy landscapes generated by various optical methods [1,2,3,4,5,6,7,8] or structured surfaces [9]. Such static and dynamical substrates can produce a variety of new particle segregation mechanisms [2,7,4,6] as well as novel types of logic devices [3]. Driven particles on periodic substrates can also exhibit enhanced diffusive properties such as the recently proposed giant enhancement of the diffusion which occurs at the threshold between pinned and sliding states [10,11,12,13,14,7]. This enhancement has been demonstrated experimentally for colloids moving over a periodic optical substrate [7] and could be important for applications which require mixing and dispersing of different species of particles [7]. A limiting factor in mixing particles through diffusion enhancement is the fact that the diffusion is enhanced only in the direction of the external drive. For instance, in a two-dimensional system with a corrugated potential that is tilted in the direction of the corrugation barriers, there is no diffusion enhancement in the direction transverse to the corrugation barriers at the pinned to sliding threshold. It would be very valuable to identify a substrate that allows for strong enhancement of the diffusion in the direction transverse to the tilt of the substrate, or one that would facilitate the mixing of particle species that are intrinsically phase separated in equilibrium. Such a substrate could be used to perform fast mixing of species and would have applications in microfluidics, chemical synthesis, and creation of emulsions and dispersions.
In this work we show that a phase separated binary assembly of interacting particles undergoes rapid mixing in the presence of a two-dimensional random substrate tilted by a driving field, and that simultaneously there is an enhancement of the diffusion transverse to the tilt direction. The motion of the particles occurs via plastic flow in the form of meandering channels which have significant excursions in the direction perpendicular to the drive, leading to mixing of the two particle species. The mixing and diffusion occur even in the absence of thermal fluctuations and arise due to the complex multi-particle interactions. We map the mixing phase diagram as a function of external drive and substrate properties and identify regimes of rapid mixing. We find that as the difference in charge between the two particle species increases, the mixing becomes increasingly asymmetric with one species penetrating more rapidly into the other. Our work shows that plastic flow can be used as a mechanism for mixing applications, and also provides a new system for the study of collective dynamical effects.
We simulate a two-dimensional system with periodic boundary conditions in the x and y directions containing two species of Yukawa particles labeled A and B with charges qA and qB, respectively. The particle-particle interaction potential between particles i and j of charges qi and qj at positions ri and rj is V(rij) = E0qiqjexp(−κrij)/rij, where E0 = Z* 2/4πϵϵ0, ϵ is the dielectric constant, Z* is the unit of charge, κ is the screening length, and rij=|rirj|. We fix κ = 4/a0, where a0 is the unit of length in the simulation. The system size is L=48a0. The motion of particle i is determined by integration of the overdamped equation of motion
η d ri

dt
= Fcci + Fsi + Fd
(1)
where η is the damping term which is set equal to unity. Here Fcci = −∑NijV(rij) is the particle-particle interaction force and N is the total number of particles in the system. The particle density is ρ = N/L2. The substrate force Fsi = −∑Npk=1Vp(rik) comes from Np parabolic trapping sites placed randomly throughout the sample. Here Vp(rik) = −(Fp/2rp)(rikrp)2Θ(rprik), where Fp is the pinning strength, rp=0.2a0 is the pin radius, rik=|rirk(p)| is the distance between particle i and a pin at position rk(p), and Θ is the Heaviside step function. The pin density is ρp=Np/L2. The external driving force Fd=Fdx is applied uniformly to all the particles. The units of force and time are F0 = E0/a0 and τ = η/E0, respectively. We neglect thermal fluctuations so that T=0. If the two particle species are initialized in a phase separated state, in the absence of an external drive and disorder the particles will not mix unless the temperature is raised above melting.
Fig1.png
Figure 1: Red circles and red lines: particle positions and trajectories for species A; blue circles and blue lines: particle positions and trajectories for species B; open black circles: pinning site locations in a system with particle density ρ = 0.7, pin density ρp=0.34, and pinning force Fp=1.0 at different driving forces. (a) Fd = 0.0, (b) Fd = 0.1, (c) Fd = 0.4, and (d) Fd = 1.1.
In Fig. 1(a) we show the initial phase separated particle configuration for a 50:50 mixture of the two particle species with qA/qB=3/2 and qA=3. The particles are placed in a triangular lattice of density ρ = 0.7 which is immediately distorted by the pinning sites of density ρp=0.34 and strength Fp=1.0. Species A occupies a larger fraction of the sample due to its larger charge qA and correspondingly larger lattice constant compared to species B. An external driving force Fd is applied in the x-direction and held at a fixed value.
Figure 1(b) illustrates the particle trajectories at Fd = 0.1 over a period of 105 simulation steps. The trajectories form meandering riverlike structures with significant displacements in the direction transverse to the drive, producing intersecting channels that permit species A to mix with species B. When the trajectories and particle positions are followed for a longer period of time, the amount of mixing in the system increases. The riverlike channel structures are typical of plastic flow of particles in random disorder, where a portion of the particles are temporarily trapped at pinning sites while other particles move past, so that the particles do not keep their same neighbors over time. This type of plastic flow has been observed in numerous one-component systems including vortices in type-II superconductors [15,16,17,18,19,20,21], electron flow in metal dot arrays [22], and general fluid flow through random disorder [23,24]. These works have shown that by changing the strength and size of the disorder, the amount of transverse wandering or tortuosity of the riverlike channels can be adjusted, and that these channels appear even for T = 0 [16,17,18,19]. In our system we measure the diffusion in the y-direction, dy = |〈ri(tyri(0)·y〉|2, and find a long time transverse diffusive motion with dy(t) ∝ tα and α = 1.0, indicative of normal diffusion. Single component systems exhibiting plastic flow also show a similar transverse diffusive behavior [17]. The diffusion in our system is not induced by thermal motion but rather occurs due to the complex many-body particle interactions that give rise to the meandering riverlike channels. In Fig. 1(c) we plot the particle trajectories in the same system at Fd=0.4. At this drive, a larger fraction of the particles are mobile and the riverlike channels become broader. As the drive is further increased, all the particles are depinned, the meandering riverlike structures are lost, and the mixing of the particles decreases. Such a state is shown in Fig. 1(d) at Fd = 1.1. For higher values of Fd > 1.1, flow similar to that shown in Fig. 1(d) appears.
Fig2.png
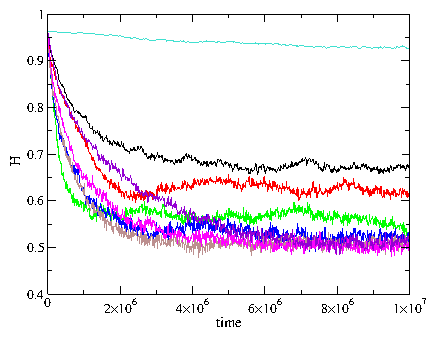
Figure 2: Measure of local homogeneity H vs time for the system in Fig. 1 at Fd= 0.05 (black), 0.1 (red), 0.25 (green), 0.4 (blue), 0.5 (brown), 0.6 (magenta), 0.7 (violet), and 1.1 (top curve). H = 1 for phase segregation and H = 0.5 for complete mixing.
In order to quantify the mixing, for each particle we identify the closest neighboring particles by performing a Voronoi tesselation on the positions of all particles in the system. We then determine the probability H that a particle is of the same species as its neighbors. If the system is thoroughly mixed, the local homogeneity H = 0.5, while if it is completely phase separated, H is slightly less than one due to the boundary between the two species. In Fig. 2 we plot H(t) for the system in Fig. 1 at different values of Fd ranging from Fd = 0.05 to Fd=1.1. For the lower drives Fd ≤ 0.1, there are few channels and a portion of the particles remain pinned throughout the duration of the simulation so that mixing saturates near H=0.6 to 0.7. For the intermediate drives 0.1 < Fd ≤ 0.5 any given particle is only intermittently pinned, so at long times all the particles take part in the motion and the system fully mixes, as indicated by the saturation of H to H = 0.5. For drives 0.5 < Fd < 0.9 the system can still completely mix but the time to reach full mixing increases with Fd. At Fd > 0.9 where the particles are completely depinned, the mixing becomes very slow as shown by the H(t) behavior for Fd = 1.1. Within the strongly mixing regime, H(t) ∝ Aexp(−t) at early times before complete mixing occurs.
Fig3.png
Figure 3: Mixing phase diagram of pinning density ρp vs driving force Fd in the form of a height map of the local homogeneity H obtained from a series of simulations with Fp = 1.0 and particle density ρ = 0.7. Strong mixing regions are blue and weak mixing regions are red.
Fig4.png
Figure 4: (a) Black line: the average particle velocity V vs Fd for a system with fp = 1.0, ρp = 0.34, and ρ = 0.7. Red line: the corresponding dV/dFd curve. (b) Black circles: local homogeneity H; red squares: net transverse displacement dy for the same system as in (a). The high mixing regime (H < 0.6) is correlated with enhanced transverse displacements and the peak in dV/dFd. dy has been shifted down for presentation purposes. (c) Particle positions (circles) and trajectories for species A (black) and species B (blue) in a system with qA/qB=3 and Fd=0.2. The mixing is asymmetric with species A moving into the region occupied by species B before species B moves into the area occupied by species A.
In Fig. 3 we plot the mixing phase diagram of pinning density ρp versus driving force Fd as determined by the local homogeneity H obtained from a series of simulations with Fp = 1.0 and ρ = 0.7. The value of H is measured after 3×10⁷ simulation time steps. Blue indicates strong mixing and red indicates weak mixing. For Fd > 1.0 and all values of ρp, all of the particles are moving in a fashion similar to that illustrated in Fig. 1(d). Since the plastic flow is lost, mixing is very inefficient in this regime. For Fd < 0.6 at high pinning densities ρp > 0.7, most of the particles are pinned, preventing a significant amount of mixing from occurring. A region of strong mixing appears at 0.6 < Fd < 0.9 for all values of ρp. Here, the particles intermittently pin and depin, producing the large amount of plastic motion necessary to generate mixing. There is another strong region of mixing for lower pinning densities 0.2 < ρp < 0.4 and low Fd < 0.4. In this regime there are more particles than pinning sites so that interstitial particles, which are not trapped by pinning sites but which experience a caging force from neighboring pinned particles, are present. At low drives the interstitial particles easily escape from the caging potential and move through the system; however, the pinned particles remain trapped so that the interstitial particles form meandering paths through the pinned particles. This result shows that even a moderately small amount of disorder combined with a small drive can generate mixing. As the pinning density is further decreased to ρp < 0.15, the amount of mixing also decreases.
In Fig. 4(a) we demonstrate how the mixing phases are connected to the transport properties of the system by plotting the net particle velocity V=〈N−1i=1N vi ·x〉 and dV/dFd versus driving force Fd for a system with ρp = 0.34 and Fp = 1.0. Here vi is the velocity of particle i. In Brownian systems, it was previously shown that an enhanced diffusion peak is correlated with a peak in the derivative of the velocity force curve [10,11,12,13,14]. Figure 4(a) shows that there is a peak in dV/dFd spanning 0.5 < Fd < 0.9 which corresponds to the region of high mixing in Fig. 3. There is also a smaller peak in dV/dFd at small drives Fd < 0.2 produced by the easy flow of interstitial particles. For Fd > 1.0, V increases linearly with Fd since the entire system is sliding freely. In Fig. 4(b) we plot the local homogeneity H for the same system taken from the phase diagram in Fig. 3. The maximum mixing (H < 0.6) falls in the same region of Fd where the peak in dV/dFd occurs. Figure 4(b) also shows that the net transverse particle displacement dy has peaks in the strong mixing regimes.
We have studied the effect of significantly increasing qA/qB so that the system is even more strongly phase separated. In general, we find the same mixing features described above; however, the time required for complete mixing to occur increases with increasing qA/qB. The mixing also becomes asymmetric: the more highly charged species A invades the region occupied by species B before the less highly charged species B spreads evenly throughout the sample. In Fig. 4(c) we illustrate the particle trajectories during the first 3 ×10⁶ simulation time steps for a system with qA/qB=3 at Fd=0.2. The mixing asymmetry can be seen from the fact that the black trails corresponding to the motion of species A overlap the blue trails representing the motion of species B, but the region originally occupied by species A contains no blue trails.
Fig5.png
Figure 5: The local homogeneity H versus the driving force Fd for a sample with Fp = 1.0 at ρp = 0.7 (black line) and ρp = 0.2 (red line). Arrows indicate the driving protocol applied to the system: Fd is first increased from 0 to 1.5, then decreased back to zero, then applied in the negative direction and decreased back to zero. Inset: The corresponding velocity V versus Fd curve for the hysteresis loops.
To determine whether the mixing is hysteretic, we sweep the driving force through a hysteresis loop and measure the response. Fig. 5 shows the mixing behavior that occurs in a sample with Fp=1.0 when the driving force is first swept in the positive direction from Fd=0 to Fd=1.5, then decreased back to zero, and then swept in the negative direction over the same range of forces before being brought back to zero again. Similar behavior occurs for higher pinning densities, represented by ρp=0.7, and lower pinning densities, represented by ρp=0.2. The plot of velocity V versus Fd in the inset of Fig. 5 indicates that the particles pass through the interstitial flow and plastic flow regimes as the drive is increased, and reach the ohmic response regime at around |Fd| ≅ 1.0. In both cases we find that once the two species of particles have mixed, they remain mixed even if the direction of the drive is reversed.
We also consider the effect of an ac drive on the particle mixing. We apply an ac drive of amplitude Aac and period Tac of the form Fac=Aacsin(2πt/Tac). As shown in Fig. 6, for long periods Tac > 1 ×10⁵ simulation time steps and large ac driving amplitudes Fac > 0.2, we are able to achieve mixing with the ac drive. Once the particles have mixed, they do not unmix even though the direction of the driving force is being varied repeatedly. If we decrease either Fac or Tac, we find a nonmixing regime in which the particles do not move sufficiently far during each period of the ac driving cycle to mix.
Fig6.png
Figure 6: Saturation value of the local homogeneity H after application of an ac drive for a system with ρp=0.7. (a) The local homogeneity H after t=6×10⁶ simulation time steps versus the driving period Tac for an ac driving force of fixed amplitude Aac = 0.2. (b) H after t=6×10⁶ simulation time steps versus the driving amplitude Aac at fixed Tac = 3×10⁵.
Our choice of initial state of the system is an unmixed configuration in which two triangular monodisperse crystals are separated by a sharp boundary. In the parameter range that we study, qA=1 and qB/qA=1.5 to 3.0, this phase separated configuration is a natural choice since it has lower energy than the mixed AB state. To demonstrate this, in Fig. 7 we plot the electrostatic energy per particle E/N for fixed qA=1 and varied qB for three different states: the AB square lattice, the phase separated state, and a relaxed phase separated state (illustrated in the inset of Fig. 7) obtained by allowing the more highly charged qB crystal to expand while the qA crystal contracts. Allowing the phase separated state to relax significantly lowers its energy, and as a result we find no transition to the mixed AB phase over the range 1 ≤ qB/qA ≤ 3. Clearly, for qB/qA=1, the phase separated state has lower energy than the AB state due to the triangular symmetry of the phase separated state, which gives a lower energy in a one-component system than the square symmetry of the AB state. Figure 7 shows that the relaxed phase separated state remains lower in energy than the AB state for 1 ≤ qB/qA ≤ 3, even when the energy of the unrelaxed phase separated state is higher than that of the AB state. For qB/qA > 3, the AB state becomes the ground state when minimizing the interaction between the qB charges becomes the dominant energy contribution. We note that for bidisperse mixtures in which the A and B particles have opposite sign, qB/qA < 0, the interface between the A and B particles decreases the overall energy. In this case, configurations such as the AB state which maximize the interface are always preferred over the phase separated state.
As a separate check of the stability of our unmixed ground state, we prepared an unpinned, undriven system and measured the temperature required to produce the same amount of mixing that we obtained in our driven system. We find that a high temperature of T ≅ 1.5 is necessary, indicating that there is a significant kinetic barrier for particle reorganization. For this reason, at zero temperature the system remains in the mixed configuration once it has been mixed, even if its true ground state is the phase separated initial state.
Fig7.png
Figure 7: Electrostatic energy per particle E/N as a function of qB/qA for fixed qA=1.0. Solid line: AB configuration; dashed line: evenly spaced phase separated configuration; black dots: relaxed phase separated configuration. The parameter range considered in this paper is qB/qA > 1, to the right of the vertical line. We extend the plot to qB/qA < 0 to indicate the parameter regime where the AB state is strongly favored over the phase separated state. Inset: equilibrium particle positions for the relaxed phase separated configuration with qA=1 (filled red circles) and qB=3 (empty circles).
One issue is whether the results reported here apply more generally for other types of particle interactions. We considered only Yukawa interactions; however, the meandering channel structures which lead to the mixing are a universal feature of one-component systems undergoing plastic flow though random quenched disorder. Studies performed on systems with long-range logarithmic interactions [17] as well as short range interactions [24] which show this plasticity lead us to believe that plastic flow generated by random disorder can produce enhanced mixing for a wide range of particle interactions. For our specific system of Yukawa particles, experiments on single component systems have already identified a channel-like plastic flow regime [9].
In summary, we have shown that two-dimensional plastic flow induced by quenched disorder in the absence of thermal fluctuations can lead to efficient mixing and enhanced diffusion in phase separating systems. This mixing occurs due to the meandering of particles through riverlike flow structures. We map the general mixing phase diagram and find that mixing is optimized in regimes where the particles depin in an intermittent fashion. For higher external drives the mixing is strongly reduced. These results should be general to a variety of systems where meandering flow channels appear.
This work was carried out under the auspices of the NNSA of the U.S. DoE at LANL under Contract No. DE-AC52-06NA25396.

References

[1]
D.G. Grier, Nature (London) 424, 810 (2003).
[2]
S.H. Lee, K. Ladavac, M. Polin and D.G. Grier, Phys. Rev. Lett. 94, 110601 (2005).
[3]
D. Babic and C. Bechinger, Phys. Rev. Lett. 94, 148303 (2005).
[4]
P.T. Korda, G.C. Spalding, and D.G. Grier, Phys. Rev. B 66, 024504 (2002); P.T. Korda, M.B. Taylor, and D.G. Grier, Phys. Rev. Lett. 89, 128301 (2002).
[5]
M. Brunner and C. Bechinger, Phys. Rev. Lett. 88, 248302 (2002); K. Mangold, P. Leiderer, and C. Bechinger, ibid. 90, 158302 (2003).
[6]
M.P. MacDonald, G.C. Spalding, and K. Dholakia, Nature (London) 426, 421 (2003).
[7]
S.H. Lee and D.G. Grier, Phys. Rev. Lett. 96, 190601 (2006).
[8]
V. Blickle, T. Speck, C. Lutz, U. Seifert, and C. Bechinger, arXiv:0704.2283.
[9]
A. Pertsinidis and X.S. Ling, submitted.
[10]
G. Costantini and F. Marchesoni, Europhys. Lett. 48, 491 (1999).
[11]
P. Reimann, C. Van den Broeck, H. Linke, P. Hänggi, J.M. Rubi, and A. Perez-Madrid, Phys. Rev. E 65, 031104 (2002).
[12]
D. Dan and A.M. Jayannavar, Phys. Rev. E 66, 041106 (2002).
[13]
S. Bleil, P. Reimann, and C. Bechinger, Phys. Rev. E 75, 031117 (2007).
[14]
K. Lindenberg, A.M. Lacasta, J.M. Sancho, and A.H. Romero, New J. Phys. 7, 29 (2005).
[15]
H.J. Jensen, A. Brass, and A.J. Berlinsky, Phys. Rev. Lett. 60, 1676 (1988).
[16]
D. Domínguez, Phys. Rev. Lett 72, 3096 (1994).
[17]
A.B. Kolton, D. Domínguez, and N. Grønbech-Jensen, Phys. Rev. Lett. 83, 3061 (1999).
[18]
C.J. Olson, C. Reichhardt, and F. Nori, Phys. Rev. Lett. 80, 2197 (1998).
[19]
K.E. Bassler, M. Paczuski, and G. F. Reiter, Phys. Rev. Lett. 83, 3956 (1999).
[20]
S. Bhattacharya and M.J. Higgins, Phys. Rev. Lett. 70, 2617 (1993).
[21]
A. Tonomura, H. Kasai, O. Kamimura, T. Matsuda, K. Harada, J. Shimoyama, K. Kishio, and K. Kitazawa, Nature (London) 397, 308 (1999).
[22]
A.A. Middleton and N.S. Wingreen, Phys. Rev. Lett. 71, 3198 (1993).
[23]
J. Watson and D.S. Fisher, Phys. Rev. B 54, 938 (1996).
[24]
M.S. Tomassone and J. Krim, Phys. Rev. E 54, 6511 (1996); N. Maleki-Jirsaraei, A. Lindner, S. Rouhani, and D. Bonn, J. Phys. Cond. Mat. 17, S1209 (2005).


File translated from TEX by TTHgold, version 4.00.

Back to Home