 Figure 2:
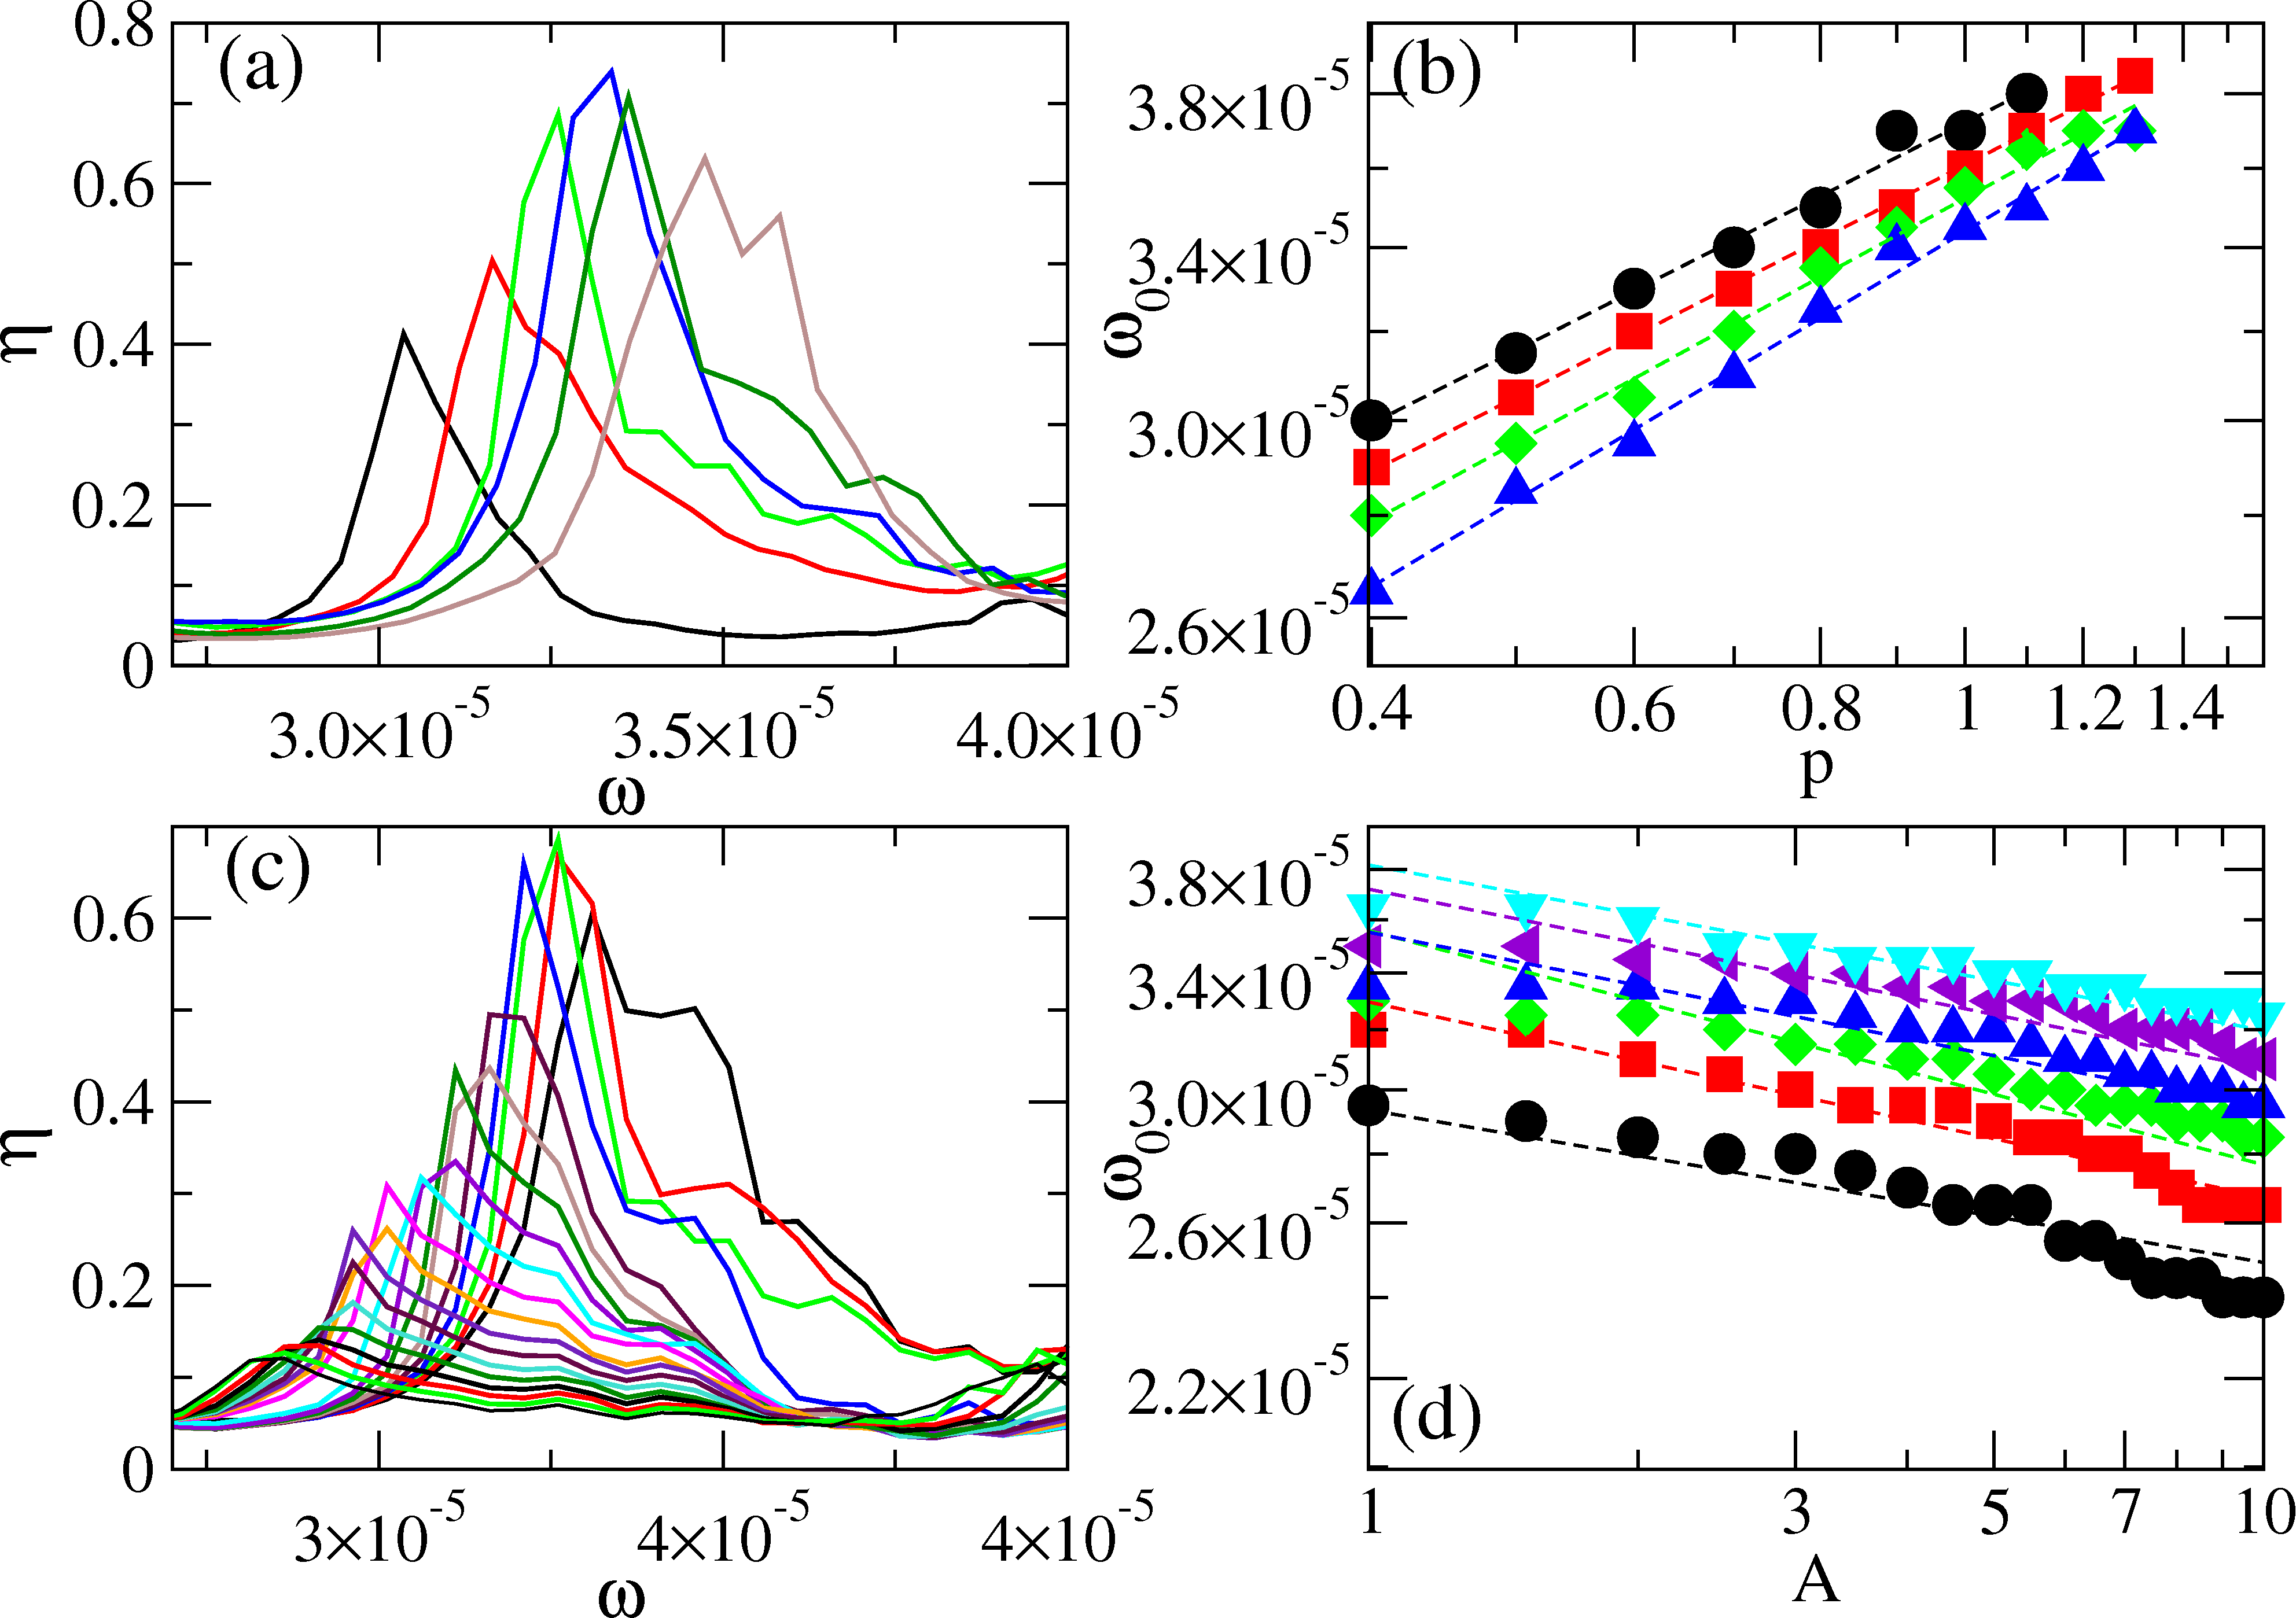
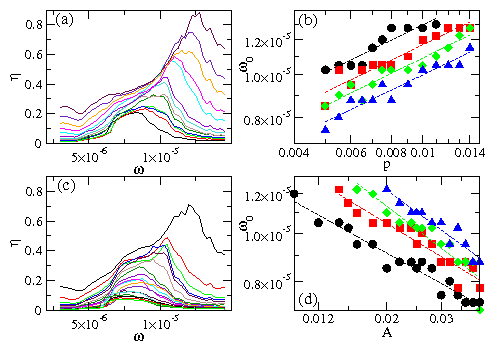
(Color online) Results from the compressional dynamic simulation.
(a) Scaled amplitude of detected response
η vs driving frequency ω
at A=0.025
for increasing static pressure p=0.0050,
0.0055, 0.0060, 0.0065, 0.0070, 0.0075, 0.0080,
0.0090, 0.0100, 0.0110, 0.0120, 0.0130, and 0.0140
(bottom to top), showing a shift of the
resonant peak ω0 to higher frequencies with increasing p.
(b)
Resonant frequency ω0 vs static pressure p
on a log-log scale, indicating an increase
in the elastic wave velocity with increasing static pressure, for
different values of the dynamic amplitude A=0.015, 0.020, 0.025,
and 0.030, from top to bottom.
Dashed lines are fits to ω0 ∝ pβ with β ≈ 0.35.
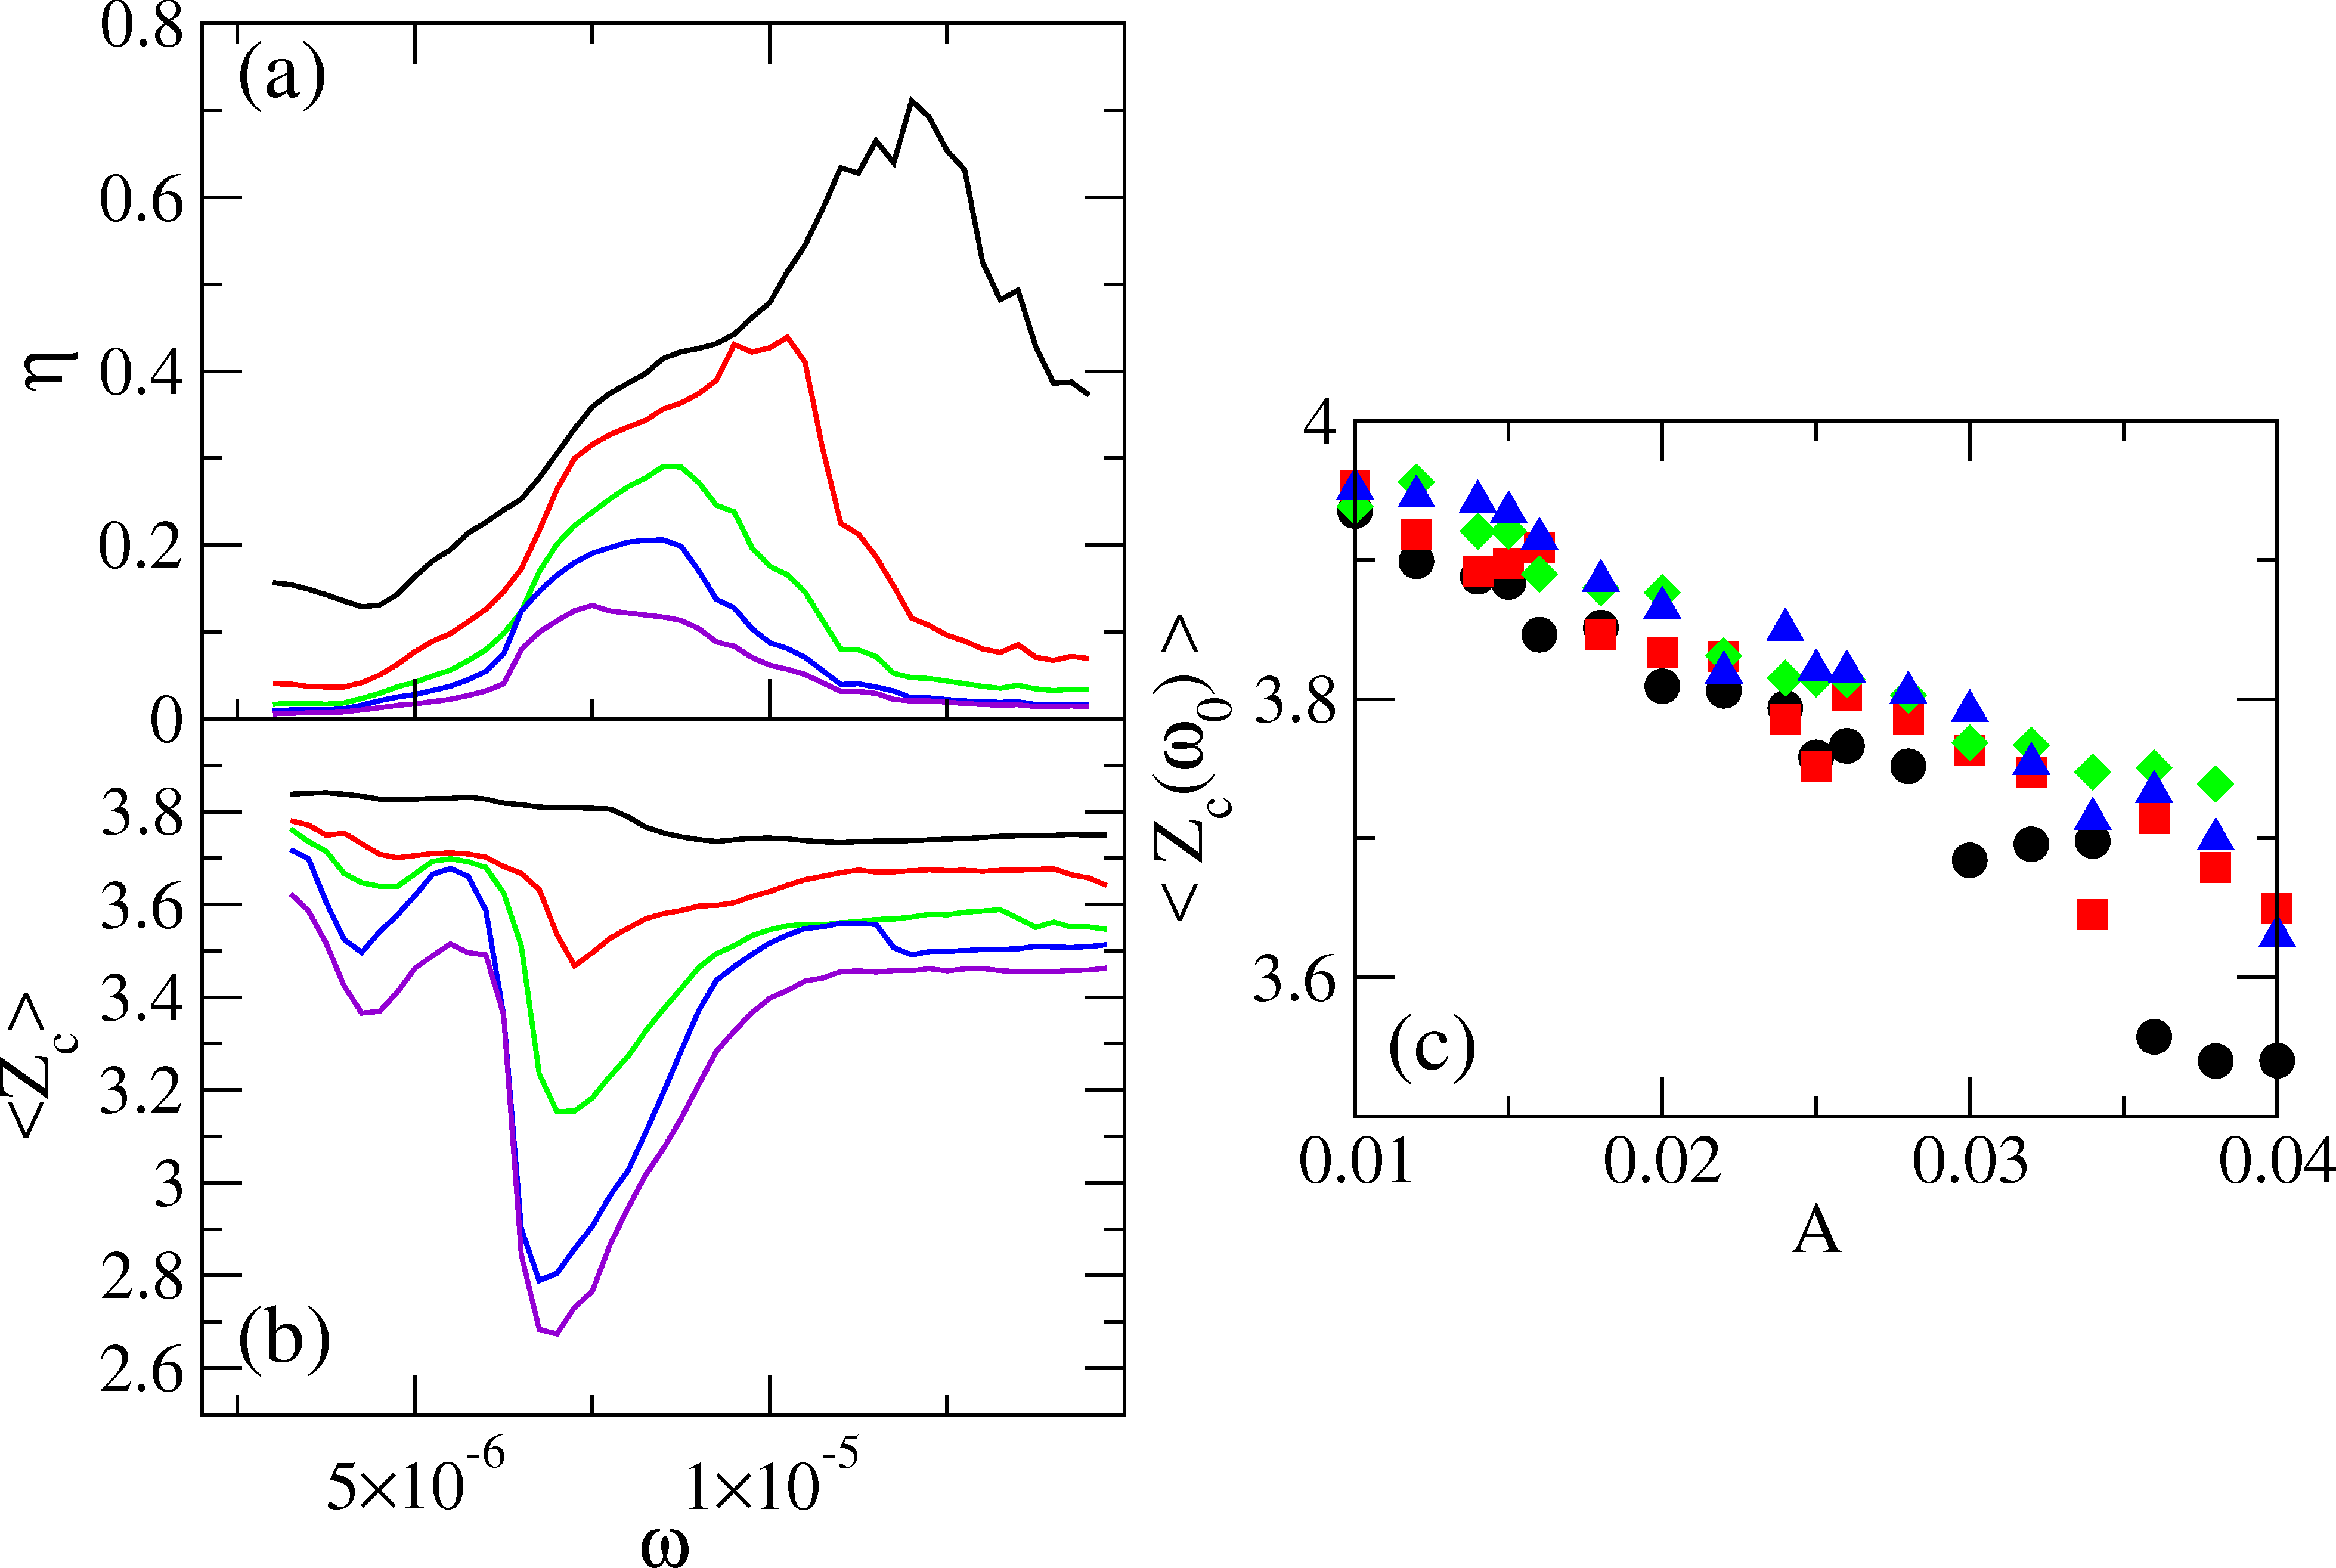
(c)
η vs ω
at p=0.0050
for increasing dynamic amplitude A=0.010,
0.012, 0.014, 0.015, 0.016, 0.018, 0.020, 0.022, 0.024,
0.025, 0.026, 0.028, 0.030, 0.032, 0.034, 0.036, 0.038, and 0.040
(top to bottom), showing a shift of the
resonant peak to lower frequencies with increasing A.
(d)
Resonant frequency ω0 vs dynamic amplitude A,
on a log-log scale, indicating a decrease
in the elastic wave velocity with increasing A, for
different values of the static pressure p=0.005, 0.007, 0.009, and
0.011, from bottom to top.
Dashed lines are fits to ω0 ∝ A−β with β ≈ 0.4.
Figure 2:
(Color online) Results from the compressional dynamic simulation.
(a) Scaled amplitude of detected response
η vs driving frequency ω
at A=0.025
for increasing static pressure p=0.0050,
0.0055, 0.0060, 0.0065, 0.0070, 0.0075, 0.0080,
0.0090, 0.0100, 0.0110, 0.0120, 0.0130, and 0.0140
(bottom to top), showing a shift of the
resonant peak ω0 to higher frequencies with increasing p.
(b)
Resonant frequency ω0 vs static pressure p
on a log-log scale, indicating an increase
in the elastic wave velocity with increasing static pressure, for
different values of the dynamic amplitude A=0.015, 0.020, 0.025,
and 0.030, from top to bottom.
Dashed lines are fits to ω0 ∝ pβ with β ≈ 0.35.
(c)
η vs ω
at p=0.0050
for increasing dynamic amplitude A=0.010,
0.012, 0.014, 0.015, 0.016, 0.018, 0.020, 0.022, 0.024,
0.025, 0.026, 0.028, 0.030, 0.032, 0.034, 0.036, 0.038, and 0.040
(top to bottom), showing a shift of the
resonant peak to lower frequencies with increasing A.
(d)
Resonant frequency ω0 vs dynamic amplitude A,
on a log-log scale, indicating a decrease
in the elastic wave velocity with increasing A, for
different values of the static pressure p=0.005, 0.007, 0.009, and
0.011, from bottom to top.
Dashed lines are fits to ω0 ∝ A−β with β ≈ 0.4.
|