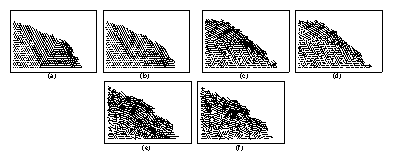
 Figure 3: Dynamic images of granular collapse from simulation
at pairs of consecutive time intervals after the
right wall of the container has been removed. Circles indicate the
location of individual grain elements, light lines indicate bonds for
dimers and trimers, and heavier lines indicate the trajectories over a
short time of the individual grain elements. (a,b) Monomers, showing
orderly flow along lattice vector directions of large triangular wedges.
(c,d) Dimers, showing tumbling flow along the top surface of the pile
only. (e,f) Trimers, showing disorderly flow throughout the bulk,
with tumbling motion at the top of the pile.
|

