Nuclear Instruments and Methods in Physics Research B 267, 1918 (2009)

Irradiation effects in an HfO2/MgO/HfO2 tri-layer structure induced by 10 MeV Au ions

I.O. Usov*, J.A. Valdez, J. Won, M. Hawley, D.J. Devlin, R.M. Dickerson, B.P. Uberuaga, Y.Q. Wang, C.J. Olson Reichhardt, G.D. Jarvinen, K.E. Sickafus

Los Alamos National Laboratory, Mailstop K763, Los Alamos, New Mexico 87545, USA

ARTICLE INFO
Article history:
Received 19 December 2008
Received in revised form 6 March 2009
Available online 2 April 2009
Keywords:
Hafnia
Magnesia
Ion irradiation

Abstract
In this report, we present radiation damage effects in a thin film, tri-layer structure, HfO2/MgO/HfO2. Irradiations were performed with 10 MeV Au ions in a recently developed medium energy ion irradiation facility at Los Alamos National Laboratory, which is described in this paper. Energy deposition by 10 MeV Au ions corresponds to a mixed regime, wherein electronic and nuclear stopping contribute to radiation damage. In this study, we investigated modifications of both surface and bulk properties in order to assess the structural stability of our oxide tri-layers under the severe irradiation conditions employed here. The most dramatic structural changes were observed to occur on the surfaces of the tri-layer samples. Surface features consisted of large craters and spires. The dimensions of these craters and spires exceed those of the individual ion tracks by almost three orders of magnitude. As for the bulk tri-layer structure, our conclusions are that this structure is stable in terms of: (i) resistance to amorphization; (ii) resistance to compositional mixing and (iii) resistance to pronounced nucleation and growth of extended defects. The main effect observed in the tri-layer structure was the transformation of the first HfO2 layer from a monoclinic to either a tetragonal or cubic form of HfO2 .


1. Introduction
2. Background: a tri-layer, HfO2/MgO/HfO2 thin film structure
2.1. Experimental details: a medium energy irradiation set up
2.2. Experimental details: HfO2/MgO/HfO2 tri-layer target preparation and ion irradiation characteristics
3. Results and discussion
4. Conclusions
References

1.  Introduction

Radiation effects in oxide ceramics are important because of potential applications of these materials as nuclear fuel or waste forms [1, 2, 3, 4]. Ceramic oxides such as UO2, ZrO2, MgO, and MgAl2O4 have attracted particular interest because of their excellent radiation stability. Tolerance to radiation damage produced by energetic particles is considered to be a basic criterion for selection of materials suitable for nuclear energy applications.
Radiation damage build-up in ceramic oxide materials has been primarily studied using heavy ions with low (few 10-100 keV) or high (few 100 MeV-GeV) energies. In the former case, damage is produced primarily in the nuclear stopping regime by energy transfer from incident ions to target atoms. In the second case, damage is produced in the electronic stopping regime by the energy transfer from the incident ions to target electrons. Atomic displacements in this instance are attributed to Coulomb explosion [5] or thermal spike mechanisms [6]. There is an intermediate energy range, from a few MeV to few 10 MeV, where damage is produced by combined contributions from nuclear, (dE/dx)n, and electronic, (dE/dx)e, energy losses. Features of radiation damage build-up in this energy range may differ from the cases in which only one stopping mechanism dominates. However, this energy range has not been thoroughly studied in oxide ceramics.
The purpose of this report is to present radiation damage phenomena observed in a particular composite oxide ceramic, namely HfO2-MgO, in the intermediate energy regime described above.

2.  Background: a tri-layer, HfO2/MgO/HfO2 thin film structure

In this study, we synthesized thin film, HfO2/MgO/HfO2 tri-layer samples deposited on Si substrates. This study is part of a larger effort to investigate the properties of HfO2/MgO composites as surrogates for a dispersion nuclear fuel form with a microstructure tailored to induce fission product (FP) separation during service [7]. The HfO2 in our experiments is intended to simulate the fissile component of a nuclear fuel (e.g. UO2). The MgO is intended to represent an inert matrix phase in a composite fuel. By way of introduction, we provide here some information regarding our dispersion fuel concept. Our dispersion fuel consists of small (few micron diameter) actinide-bearing fuel particles dispersed in an inert host matrix. FPs originate inside the fuel particles with high kinetic energies (up to ~100 MeV) and travel up to few micrometers in the fuel. If the size of nuclear fuel particles is less than the range of the FPs, the FPs will escape the particles and come to rest in the host matrix. Thus, a natural partitioning evolves between the fuel actinides and the FPs, as this fuel burns. By choosing a matrix material that can be selectively chemically dissolved, one can separate the nuclear fuel particles from the FPs produced during burn-up. This separation strategy may substantially reduce technological challenges associated with conventional spent fuel reprocessing procedures.
The layered structure used in these experiments consists of two actinide surrogate thin films of fuel surrounding an inert matrix layer, wherein MgO is the inert matrix and HfO2 is the actinide oxide surrogate. While the layered structure is not equivalent to a bulk particle dispersion, this geometry is well-suited to materials characterization techniques and to computer modeling. We are currently examining radiation stability and radiation damage effects in a variety of thin film geometries, including bi-layers, tri-layers, and higher order layered structures. We present here preliminary results, we have obtained on samples with a tri-layer geometry.

2.1.  Experimental details: a medium energy irradiation set up

A medium energy ion irradiation set up was installed on the 15° beam line of the 3.2 MV NEC Tandem accelerator in the Ion Beam Materials Laboratory (IBML) at Los Alamos National Laboratory. This accelerator is supplied with a SNICS II ion source. After selecting an ion beam of a given mass and energy via a switching magnet, the beam is directed through a pair of energy stabilizing slits. The stabilizing slits are formed by two vertical plates with a separation width of 6 mm. The beam current is measured using a retractable Faraday cup (FC) mounted downstream from the stabilizing slits. The initial irradiation damage experiments have been performed using gold (Au) ions. The highest Au ion charge state at which an ion current of a few 100 nA can be produced is +5. This sets a practical limit to the ion energy of ~20 MeV. Higher charge states can be used to achieve higher ion energies, but the ion current drops significantly. Therefore, these high energy ions are restricted to very low fluence irradiations. Beam focusing is monitored by two sets of beam profile monitors. The first one is mounted in front of the stabilizing slits and the second one is located in front of the pre-chamber slits. The beam is focused to a spot a few millimeters in diameter by the quadrupole doublet lens located before the switching magnet. The ion beam steering and scanning is achieved using an XY magnetic scanner. The scanning signal is superimposed on a DC steering voltage. The scanning frequency is set to 6×10⁻³ and 0.5 Hz for X- and Y-directions, respectively. To ensure irradiation uniformity, the scanning amplitude is set slightly larger than the irradiation dimensions defined by the pre-chamber slits. The standard irradiation area, which provides enough material for various characterization techniques, is set to 12×5 mm2. The sample holder is mounted in the chamber, which is electrically isolated from the beam line and vacuum pumping system, and connected to the current integrator. The absolute accuracy of current measurements is estimated to be ~4%. This estimate was obtained from a comparison of fluence estimated from the measured charge and irradiated area and Rutherford backscattering spectroscopy (RBS) measurements of a Si wafer implanted with 4 MeV Au 3+ ions to the fluence of 2×10¹⁵ Au/cm2 . The chamber is evacuated by a turbo molecular pump and an oil-free mechanical pump. Ion irradiation is carried out when the chamber vacuum reaches pressure of 1×10⁶ Torr. A pyrometer is mounted on a viewport for sample surface temperature measurements during irradiation.

2.2.  Experimental details: HfO2/MgO/HfO2 tri-layer target preparation and ion irradiation characteristics

We have initiated a study of radiation effects on chemical and physical properties of thin film, multi-layered structures. In particular, a tri-layer structure of HfO2/MgO/HfO2 was deposited by e-beam evaporation onto a (1 1 1) Si substrate. The thicknesses of the upper and lower HfO2 layers were 71 and 59 nm, respectively, while the middle MgO layer thickness was 869 nm (measured directly from transmission electron microscopy images, presented later). In the as-deposited tri-layer, the HfO2 layers were amorphous while the MgO layer was crystalline (determined by X-ray diffraction). The as-deposited sample was then annealed in air at 550°C for 12 h. The HfO2 layers were crystallized by this annealing treatment.
Next, we employed heavy ion irradiations using Au 3+ ions in a medium energy regime, namely 10 MeV. In this energy regime, both electronic and nuclear stopping play a significant role in radiation damage production and evolution. Electronic and nuclear stopping powers, and depth distribution of displacement damage for 10 MeV Au ions incident on (71 nm)HfO2/(869 nm)MgO/(59 nm)HfO2 /Si, were estimated using the SRIM2008 code [8] and LSS theory [9]. For displacement damage calculations, a displacement threshold energy of 40 eV was assigned to all elements. Layer densities assumed for MgO and HfO2 are given in Table 1.
LayerLayer areal density, RBS (at./cm2)Layer thickness, TEM (nm)Calculated density, ρ (at./cm3)Calculated porosity, × 100 (%)
Upper HfO24.3 × 1017716.0 × 102227
MgO8.7 × 10188691.0 × 10236
Lower HfO24.0 × 1017596.7 × 102218
Table 1: Areal densities and thicknesses of individual layers in the unirradiated HfO2/MgO/HfO2 tri-layer sample, as determined by RBS and TEM, respectively. Layer densities were estimated using ρ = nRBS/tTEM, where areal densities, nRBS, and thicknesses tTEM, are in units of at/cm2 and cm, respectively. Porosity was estimated as (1 - ρ /ρth), where ρ and ρth are the calculated and theoretical densities, respectively. Theoretical densities, ρth, for HfO2 and MgO were assumed to be 8.22 × 10²² and 1.07 × 10²³ at./cm3, respectively.
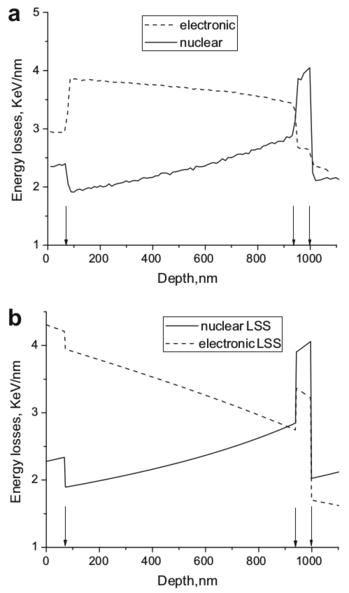
Fig. 1 shows the variations of (dE/dx)e and (dE/dx)n in the layered structure, based on SRIM (Fig. 1(a)) and LSS (Fig. 1(b)) calculations. The nuclear energy losses estimated by SRIM and LSS agree quite well. As expected in this ion energy range, (dE/dx)n increases with depth and changes abruptly when the Au ions pass through the upper and lower HfO2/MgO interfaces. As this occurs, the magnitude of (dE/dx)n is higher in HfO2 than in MgO, since the former is composed of heavier atoms. The electronic energy losses estimated by SRIM and LSS look quite different. According to SRIM, the (dE/dx)e magnitude in the MgO layer changes from 3.9 to 3.4 keV/nm, while LSS calculations suggest that the magnitude of (dE/dx)e in the MgO layer changes from 3.9 to 2.7 keV/nm. In both cases, the (dE/dx)e values are similar at the beginning of the MgO layer and decrease with depth, as the Au ions slow down. In the LSS calculations, (dE/dx)e decreases with the depth nearly three times faster compared to SRIM, which results in a smaller value at the end of the MgO layer. Another difference between SRIM and LSS calculations is disagreement in (dE/dx)e for both HfO2 layers. The SRIM value of (dE/dx)e in the upper HfO2 layer (2.9 keV/nm) is lower than that in the upper portion of the MgO layer (3.9 keV/nm). Likewise, (dE/dx)e in the lower HfO2 layer (2.7 keV/nm) is smaller than that in the lower portion of the MgO layer (3.4 keV/nm). We suspect that something is wrong with the SRIM calculations because the electron density in HfO2 is much larger than in MgO, so electronic energy losses should be higher in the HfO2 layers. The LSS electronic energy loss estimates in the middle of upper and lower HfO2 layers are 4.3 and 3.3 keV/nm, respectively. We believe that the LSS electronic energy loss estimates are more reasonable than the SRIM calculation results and we will refer to the LSS results for the remainder of this report. The most important result of these calculations is that a large amount of energy is transferred to target electrons in the layered structure, under our ion irradiation conditions.
Fig1.png
Figure 1: Depth distribution of electronic and nuclear energy losses in an HfO2/MgO/HfO2/Si layered sample irradiated with 10 MeV Au ions, according to SRIM (a) and LSS (b) calculations. Vertical arrows indicate interfaces between the layers. The energy losses shown here refer to the primary ion only (secondary knock-on atoms are not included).
The depth profile of displacement damage, estimated in units of dpa (displacement per atom), monotonically increases in the MgO layer, while it is relatively constant in both HfO2 layers (because these layers are very thin). The displacement damage level at the highest ion fluence used in these experiments (5.1 × 10¹⁵ Au/cm2), is 8 dpa in the upper HfO2 layer, 17 dpa in the lower HfO2 layer and varies almost linearly from 5 to 9 dpa in the MgO layer. In the sample irradiated to the lowest ion fluence used in these experiments (5 × 10¹³ Au/cm2), the amount of damage is approximately 100 times less.
Despite the fact that the electronic energy losses in the tri-layer structure differ in SRIM and LSS calculations, the projected range of the Au ions, based on these calculations, turned out to be very similar: 1.8 and 1.9 μm, respectively. The Au ions penetrate though the layered structure and stop inside the Si substrate with the implanted peak concentration centered at 0.9-1.0 μm beneath the Si surface.
As mentioned above, the tri-layer samples were irradiated with 10 MeV Au 3+ ions to two fluences: 5 × 10¹³ (low) and 5.1 × 10¹⁵ (high) Au/cm2 . The irradiations were performed at room temperature with the ion beam incident normal to the sample surface. The ion flux was 1.2 × 10¹¹ and 7.2 × 10¹¹ Au/cm2 s for the low and high fluence irradiations, respectively. Surface topography changes were observed using Nomarski optical microscopy and atomic force microscopy (AFM). Crystal structure in the near surface region was analyzed using grazing incidence X-ray diffraction (GIXRD). The chemical compositions and areal densities of each layer were determined using RBS with 1.5 MeV He + ions. Irradiation-induced dimensional changes and microstructure were investigated using cross sectional transmission electron microscopy (TEM).

3.  Results and discussion

Fig2.png
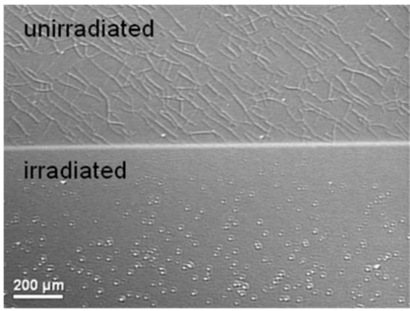
Figure 2: Optical image showing unirradiated and irradiated (10 MeV, 5.1 &215; 1015 Au/cm2) portions of the surface of the HfO2/MgO/HfO2/Si layered sample.
Fig. 2 shows a Nomarski optical image obtained from a partially-masked surface of an HfO2/MgO/HfO2/Si tri-layer sample. The irradiated portion of the sample was exposed to an ion fluence of 5.1 × 10¹⁵ Au/cm2 . The sample was masked at the position of the bright horizontal line in the image in Fig. 2. The unirradiated surface region exhibits a large number of cracks. These cracks formed after annealing of the as-deposited tri-layer and presumably are a consequence of differences in thermal expansion coefficients between the HfO2 and MgO films and the Si substrate. The sample surface in the irradiated portion of the sample was modified by ion irradiation. Most notably, the cracks disappeared and large craters formed. The craters (Fig. 2) have a circular shape and these craters have similar dimensions, except for craters in the region adjacent to the interface with the unirradiated portion of the sample. Craters close to the boundary between the irradiated and unirradiated sample regions (Fig. 2) are noticeably smaller than craters in the irradiated regions well away from this boundary. This change in morphology may be due to stress/strain effects [10]. The crater production rate, estimated as the ratio of the crater areal density to the ion fluence, was found to be ~7 × 10¹² craters per ion. In the sample irradiated to the low fluence (5 × 10¹³ Au/cm2), cracks did not disappear completely, but became less visible and craters were not observed (image not shown). Crack healing upon heat treatment is a well-established phenomenon in various ceramic materials [11], including HfO2 [12]. It is worth noting that crack healing in HfO2 begins at temperatures as low as 100°C [12]. Surface crack healing is usually attributed to surface diffusion mechanisms [11]. In our experiments, the surface temperature of the target sample was observed to be somewhat elevated during irradiation, but did not exceed 100°C. Therefore, we believe that crack healing can be related to surface diffusion enhanced by ion irradiation. The large magnitudes of electronic and nuclear energy losses for 10 MeV Au irradiating ions make it possible that atomic diffusion is significantly enhanced under our irradiation conditions (see Bourgoin and Corbett [13]).
Fig3.png
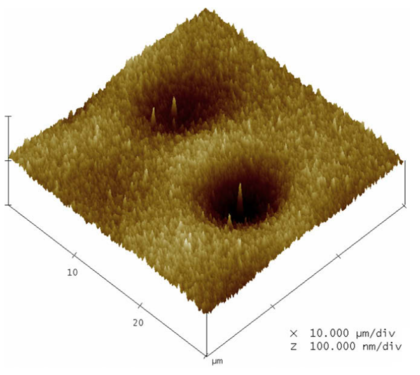
Figure 3: AFM image of the crater/spire features formed after irradiation with 10 MeV Au ions to a fluence of 5.1 × 10¹⁵ Au/cm2.
Fig. 3 shows a surface topography image, obtained using AFM, of an HfO2/MgO/HfO2/Si tri-layer sample irradiated to a fluence of 5.1 × 10¹⁵ Au/cm2 (same as the sample in Fig. 2). The AFM image reveals that situated in the middle of each crater is a sharp spire. The crater located in the lower part of the image in Fig. 3 has a diameter of 14 μm and depth of ~70 nm. The spire height (~71 nm) is similar to the crater depth and the measured crater diameter at its base is ~2 μm. The measured crater depth corresponds closely to the initial thickness of the upper HfO2 layer, which may indicate that the crater/spire features originate at the upper HfO2/MgO interface. However, after taking into account reduction of the first HfO2 layer thickness due to sputtering (discussed later), the crater bottom and the spire base seem to be within the MgO layer. Accurate detection of the location of the crater bottom and the spire base may help to elucidate the nature of these unusual features. The shape of the crater rims observed here suggests that material was not just removed but rather pushed radially around each crater. Each spire originates at a crater bottom and the spire tip reaches the sample surface. To our knowledge, no such features have ever before been observed in ion irradiated solids. Craters and hillocks with dimensions of few 10s of nanometers have been observed previously after high energy ion irradiation [14]. These features are usually attributed to single ion tracks and are observed at low fluence when the individual tracks do not overlap. In our experiments, the electronic stopping power was not nearly as high as in the experiments referenced above. The ion fluence used here was much larger, and the feature sizes observed here are enormous compared to ion track dimensions. Thus, traditional models based on ion tracks produced by single energetic particles cannot be applied here. The cause of the crater/spire feature formation is not yet clear and further investigations are in progress to clarify this phenomenon. Our current hypothesis is that these features are likely due to surface and perhaps stress effects, specific to our thin film architecture. It is also interesting that after irradiation, the roughness of the sample surface, measured away from the crater/spire features, changes (rather insignificantly) from 6.1 to 6.8 nm at the low ion fluence used in these experiments and to 5.5 nm at the highest ion fluence. Roughness reduction at high fluence may be related to surface smoothening by crack healing.
Fig4.png
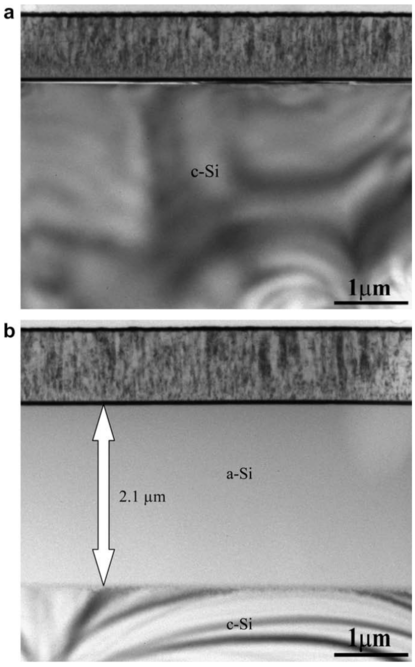
Figure 4: Cross-sectional TEM images obtained from the HfO2/MgO/HfO2/Si layered sample: (a) unirradiated; and (b) irradiated with 10 MeV Au ions to the fluence of 5.1 × 10¹⁵ Au/cm2 . Amorphous and crystalline regions in the Si substrate are labeled a-Si and c-Si, respectively. The light contrast at the top of each micrograph is the glue layer used in cross-sectional TEM preparation. The thin white line beneath the lower HfO2 layer in (a) is a hole in the sample, formed during TEM sample preparation due to preferential ion milling.
In Fig. 4, we show low magnification cross-sectional TEM images of the unirradiated microstructure (Fig. 4(a)) and the high fluence irradiated microstructure away from any crater/spire feature (Fig. 4(b)). Fig. 4(a) indicates that the unirradiated MgO layer consists of aligned columnar grains. This layer is sandwiched between two dark bands corresponding to HfO2 layers. This layered architecture demonstrated good stability under irradiation. TEM analysis revealed that the thickness of the upper HfO 2 layer was reduced following irradiation by ~12%, while the middle MgO and the lower HfO2 layer thicknesses were unchanged by irradiation. Thickness reduction of the upper HfO2 layer can be attributed to surface sputtering. Fig. 4(b) also demonstrates that the Si substrate is completely amorphized to a depth of 2.1 μm, following irradiation to a fluence of 5.1 × 10¹⁵ Au/cm2 .
Fig5.png
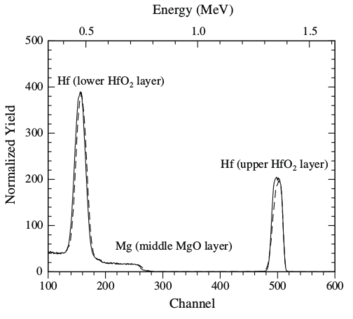
Figure 5: RBS spectra obtained from the HfO2/MgO/HfO2/Si layered sample before (solid curve) and after (dashed curve) irradiation with 10 MeV Au ions to a fluence of 5.1 × 10¹⁵ Au/cm2.
The composition and thickness of individual layers before and after irradiation were also analyzed by RBS. RBS spectra are shown in Fig. 5. Peaks corresponding to backscattering from the Hf atoms in the upper and lower HfO2 layers, and Mg atoms in the middle MgO layer, are labeled in Fig. 5. The surface edge due to backscattering from O atoms is hidden by the second Hf peak. In the unirradiated tri-layer sample, the HfO2 and MgO layers were found to be stoichiometric with sharp interfaces between the layers. Areal densities in at./cm2 units of each layer of the unirradiated sample were determined by fitting the RBS spectrum with the RUMP code [15] (see Table 1). TEM was used to measure the layer thicknesses, from which, in combination with the RBS areal densities, the bulk densities of each layer were estimated. Due to thin film porosity, the calculated thin film densities are less than the theoretical densities. We used the difference between calculated and theoretical densities to estimate the porosity in our thin film layers (Table 1). We did not observe significant changes in porosity of the individual layers upon irradiation.
After low fluence irradiation (5 × 10¹³ Au/cm2), the measured RBS spectrum was almost identical to that obtained from the unirradiated sample. Irradiation to the high fluence (5.1 × 10¹⁵ Au/cm2) resulted in sputtering of ~12% of the upper HfO2 layer, which produces small shifts of the lower Hf peak and the Mg edge towards higher channel numbers. It should be noted that the RBS analysis was performed over an area of 1 × 1 mm2 , which includes a large number of crater/spire features. Therefore, the fact that the thickness reduction of the first HfO2 layer, measured by RBS and TEM (when the features were not included) is almost the same, indicates that the craters were not formed by removal of HfO2 material, but rather by its lateral redistribution.
Fig6.png
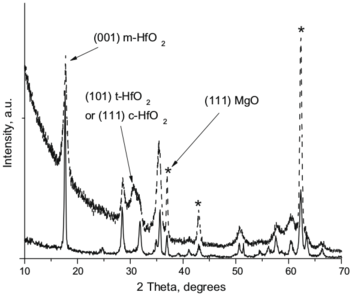
Figure 6: GIXRD patterns of the HfO2/MgO/HfO2 layered sample: before (solid line) and after (dotted line) irradiation with 10 MeV Au ions to a fluence of 5 × 10¹³ Au/cm2 . Peaks corresponding to MgO are labeled by star symbols and unlabeled peaks are from m-HfO2 . The preferred orientations in the unirradiated sample ((0 0 1) m-HfO2 and (1 1 1) MgO) and a new phase formed after irradiation ((1 0 1) t-HfO2 or (1 1 1) c-HfO2) are indicated by arrows.
GIXRD was used to probe for possible phase transformations induced by ion irradiation. Fig. 6 shows diffraction patterns obtained from the tri-layer sample before and after irradiation to the low fluence (5 × 10¹³ Au/cm2 ). The GIXRD patterns in Fig. 6 were obtained at a grazing incidence angle of 0.5°. At this shallow angle only the first HfO2 layer and the top part of the MgO layer contribute to the diffraction. Analysis of the GIXRD pattern obtained from the unirradiated sample revealed that this sample consists of monoclinic HfO2 (m-HfO2) and MgO. The peak ratios differ from the ratios associated with the structure factors for a random assemblage of HfO2 and MgO grains, indicating that the layers in our films are textured. The preferred orientations (normal to the sample surface) were found to be (1 1 1) MgO and (0 0 1) m-HfO2. After irradiation, the m-HfO2 peaks became broader and the background at scattering angles 2θ < 38° increased significantly. Also, a new diffraction peak appeared at 2θ ~ 30.6°. No evidence was found by GIXRD for changes in the crystal structure of the MgO layer. This is indicative of the excellent radiation stability of the MgO (specifically against phase transformation). The background increase and peak broadening observed in m-HfO2 can be attributed to damage and strain build-up in the first HfO2 layer. This background increase could also be due to the appearance of crater/spire features. More detailed GIXRD and TEM studies are in progress, to quantify lattice distortions and separate them from the effect of grain size reduction, which may also contribute to the peak width increase.
We interpret the observation of the new peak at 2θ ~ 30.6°, following ion irradiation, as evidence for an irradiation-induced phase transformation from m-HfO2 to either the tetragonal (t-HfO2) or cubic (c-HfO2) polymorph of HfO2 (using this reflection only, the tetragonal and cubic phases cannot be distinguished). This transformation takes place in the first HfO2 layer. Some of the m-HfO2 diffraction peaks persist following irradiation, which indicates that only a fraction of the m-HfO2 experiences the phase transformation. An m → t phase transformation in HfO2 has been reported previously for heavy ion irradiations in the electronic stopping regime and it was found that a threshold value of (dE/dx)e > 18.3 keV/nm was required for this m → t phase transformation to occur [16]. In our experiments, (dE/dx)e is almost four times less than the (dE/dx)e used in the experiments reported in [16] (see Fig. 1(b)). However, our (dE/dx)n is two orders magnitude higher than that used in [16]. Thus, we believe that the phase transformation in the first HfO2 layer is caused by a combination of nuclear and electronic stopping effects.

4.  Conclusions

A new medium energy (up to ~20 MeV) ion irradiation capability is described, which was developed in the IBML at Los Alamos National Laboratory. Using this capability, we report here on radiation effects produced by 10 MeV Au + ions in a thin film, tri-layer structure, HfO2/MgO/HfO2, intended to represent a dispersion nuclear fuel. We observed a number of ion irradiation-induced effects including: crack healing, sputtering, and phase transformation. In addition, we observed an unusual surface modification, namely the formation of large (14 μm diameter) crater/spire features. No amorphization of either the HfO2 or MgO layers was observed, nor was there any evidence of significant interlayer mixing.

Acknowledgment

This work was supported by a Los Alamos National Laboratory, Laboratory Directed Research and Development (LDRD) Grant.

References

[1]
Hj. Matzke, Radiat. Effect 64 (1982) 3.
[2]
L.W. Hobbs, F.W. Clinard, S.J. Zinkle, R.C. Ewing, J. Nucl. Mater. 216 (1994) 291.
[3]
J. Zinkle, C. Kinoshita, J. Nucl. Mater. 251 (1997) 200.
[4]
K.E. Sickafus, L. Minervini, R.W. Grimes, J.A. Valdez, M. Ishimaru, F. Li, K.J. McClellan, T. Hartmann, Science 289 (2000) 748.
[5]
R.L. Fleischer, P.B. Price, R.M. Walker, J. Appl. Phys. 36 (1965) 3645.
[6]
F. Seitz, J.S. Koehler, Solid State Phys. 2 (1956) 305.
[7]
G.D. Jarvinen, D.W. Carroll, D.J. Devlin, United States Patent Application No. S-100,559, 2004.
[8]
J.F. Ziegler, J.P. Biersack, U. Littmark, The Stopping and Range of Ions in Solids, Pergamon, New York, 1985.
[9]
J. Lindhard, M. Scharff, H.E. Schiott, Mat. Fys. Medd. Dan Vid. Selsk. 33 (1963) 3.
[10]
C. Trautmann, S. Klaumunzer, H. Trinkaus, Phys. Rev. Lett. 85 (2000) 3648.
[11]
T.K. Gupta, in: W.D. Kingery (Ed.), Structure and Properties of MgO and Al2O3 Ceramics, The American Ceramic Society 1984.
[12]
S.L. Dole, O. Hunter, F.W. Calderwood, D.J. Bray, J. Am. Ceram. Soc. 61 (1978) 486.
[13]
J.C. Borgoin, J.W. Corbett, Radiat. Effect 36 (1978) 157.
[14]
R. Neumann, Nucl. Instr. and Meth. B 151 (1999) 42.
[15]
L.R. Doolittle, Nucl. Instr. and Meth. B 9 (1985) 344.
[16]
A. Benyagoub, Nucl. Instr. and Meth. B 218 (2004) 451.


File translated from TEX by TTHgold, version 4.00.
Back to Home